Хуки дают возможность получать информацию о жизненном цикле управления контейнерами и выполнять код, реализованный в обработчике (handler), при срабатывании определенного хука.
Для каждого контейнера в поде хуки определяются отдельно. Существуют два типа хуков — PostStart и PreStop. Первый является асинхронным и выполняется сразу же при создании контейнера, однако нет никакой гарантии, что данный хук будет выполнен до запуска инструкции ENTRYPOINT контейнера. Стоит отметить, что если выполнение PostStart хука занимает очень много времени (или зависает), то контейнер не может перейти в состояние Running.
Хук PreStop, как видно из его названия, выполняется перед тем как контейнер будет остановлен (terminated) — будь то API-запрос или другое событие (например, неудачная liveness probe, “выдавливание” пода с узла кластера, перебор используемых ресурсов). Этот вызов синхронный, а это значит, что он обязательно должен быть завершен до того, как будет отправлен сигнал остановки контейнера.
Для хуков в жизненном цикле контейнеров предусмотрено два варианта обработчиков (handlers):
Exec — выполняет определенную команду (скрипт) в пространстве имен контейнера. Ресурсы, которые используются данной командой также учитываются в используемых ресурсах контейнера (важно при определении памяти и CPU);
HTTP — выполняет HTTP-запрос на определенный эндпоинт контейнера.
Если какой-то из хуков PostStart или PreStop завершается с ошибкой, то контейнер также будет остановлен. Логи хуков недоступны при выполнении команды kubectl logs <pod_name>, но если по какой-то причине они выполнились неудачно, то происходит событие FailedPostStartHook или FailedPreStopHook соответственно. Эти события можно увидеть выполнив команду kubectl describe pod <pod_name>.
Итак, мы вполне можем использовать PostStart хук для вставки данных в Redis при старте контейнера.
Идея состоит в следующем: с помощью ConfigMap мы добавим файл(ы) внутрь контейнера, причем названием ключа в редисе будет имя, а значением — содержимое этого файла. Далее, используя PostStart хук, мы “обработаем” каждый из файлов и вставим соответствующие данные в БД Redis.
Манифест, содержащий в себе все необходимые объекты Kubernetes, будет выглядеть так:
---

apiVersion: apps/v1

kind: Deployment

metadata:

  name: {{ .Values.deployment_name }}

  namespace: {{ .Values.namespace }}

  labels:

    app: {{ .Values.app_name }}


spec:

  replicas: {{ .Values.replica_number }}

  selector:

    matchLabels:

      app: {{ .Values.app_name }} # по вот этому лейблу репликасет цепляет под

# тут описывается каким мокаром следует обновлять поды

  strategy:

    rollingUpdate:

      maxSurge: 1  # указывает на какое количество реплик можно увеличить

      maxUnavailable: 1 # указывает на какое количество реплик можно уменьшить

#т.е. в одно время при обновлении, будет увеличено на один (новый под) и уменьшено на один (старый под)

    type: RollingUpdate

## тут начинается описание контейнера

  template:

    metadata:

      labels:

        app: {{ .Values.app_name }}  # по вот этому лейблу репликасет цепляет под

#       name_elk: elk-log-{{ .Values.namespace }} #это имя будет записываться в EFK

    spec:

      containers:

        - image: "{{ .Values.image_app.repository }}:{{ .Values.image_app.tag }}"

          imagePullPolicy: Always

          name: {{ .Values.app_name }}

          ports:

            - containerPort: {{ .Values.deployment_port }}

# тут начинаются проверки по доступности

#          readinessProbe: # проверка готово ли приложение

#            failureThreshold: 3 #указывает количество провалов при проверке

#            httpGet:  # по сути дёргает курлом на 8080 порт

#              path: /monitoring

#              port: 8080

#            periodSeconds: 20 #как часто должна проходить проверка (в секундах)

#            successThreshold: 1 #сбрасывает счётчик неудач, т.е. при 3х проверках если 1 раз успешно прошло, то счётчик сбрасывается и всё ок

#            timeoutSeconds: 1 #таймаут на выполнение пробы 1 секунда

#            initialDelaySeconds: 120

#          livenessProbe: #проверка на жизнь приложения, живо ли оно

#            failureThreshold: 3

#            tcpSocket:

#              port: 8888

#            httpGet:

#              path: /monitoring

#              port: 8080

#            periodSeconds: 20

#            successThreshold: 1

#            timeoutSeconds: 1

#            initialDelaySeconds: 10 #означает что первую проверку надо сделать только после 10 секунд


# тут начинается описание лимитов для пода

          resources:

            requests: #количество ресурсов которые резервируются для pod на ноде

              cpu: {{ .Values.requests_cpu_app }}

              memory: {{ .Values.requests_memory_app }}

            limits: #количество ресурсов которые pod может использовать(верхняя граница)

              cpu: {{ .Values.limits_cpu_app }}

              memory: {{ .Values.limits_memory_app }}

      imagePullSecrets:

      - name: {{ .Values.secret_name_gitlab_login }}
#неймспейс в котором запускаемся

namespace: test-cache-builder


#имя деплоймента

deployment_name: deployment-cache-builder-mrunner


deployment_port: 8888

service_port: 8888


#имя сервиса

service_name: service-cache-builder-mrunner


#имя ingress

ingress_name: ingress-cache-builder-mrunner


#указываем наш домен по которому будет слушать ingress

domain: cb-mrunner.prod.test.local


#количество реплик деплоймента минимальное количество

replica_number: 1


#имя лейбла сервиса

app_name: cache-builder-mrunner


#имя образа для сервиса

image_app:

  repository: gitnexus.test.local:4567/cache-builder/cache-builder/mrunner

  tag: "v5"


#количество ресурсов которые резервируются для pod на ноде проц и оперативка

requests_cpu_app: 100m

requests_memory_app: 500Mi

#количество ресурсов которые pod может использовать(верхняя граница)

limits_cpu_app: 400m

limits_memory_app: 1000Mi


#имя секрета под которым воркер ноды будут выкачивать образа из gitlab

secret_name_gitlab_login: docker-login-cache-builder
#неймспейс в котором запускаемся

namespace: test-cache-builder


#имя деплоймента

deployment_name: deployment-cache-builder-node


deployment_port: 7777

service_port: 7777


#имя сервиса

service_name: service-cache-builder-node


#имя ingress

ingress_name: ingress-cache-builder-node


#указываем наш домен по которому будет слушать ingress

domain: cbapi.prod.test.local


#количество реплик деплоймента минимальное количество

replica_number: 1


#имя лейбла сервиса

app_name: cache-builder-node


#имя образа для сервиса

image_app:

  repository: gitnexus.test.local:4567/cache-builder/cache-builder/node

  tag: "v5"


#количество ресурсов которые резервируются для pod на ноде проц и оперативка

requests_cpu_app: 100m

requests_memory_app: 500Mi

#количество ресурсов которые pod может использовать(верхняя граница)

limits_cpu_app: 400m

limits_memory_app: 1000Mi


#имя секрета под которым воркер ноды будут выкачивать образа из gitlab

secret_name_gitlab_login: docker-login-cache-builder
#неймспейс в котором запускаемся

namespace: test-cache-builder


#имя деплоймента

deployment_name: deployment-cache-builder-scheduler


deployment_port: 7777

service_port: 7777


#имя сервиса

service_name: service-cache-builder-scheduler


#имя ingress

ingress_name: ingress-cache-builder-scheduler


#количество реплик деплоймента минимальное количество

replica_number: 1


#имя лейбла сервиса

app_name: cache-builder-scheduler


#имя образа для сервиса

image_app:

  repository: gitnexus.test.local:4567/cache-builder/cache-builder/scheduler

  tag: "v5"


#количество ресурсов которые резервируются для pod на ноде проц и оперативка

requests_cpu_app: 100m

requests_memory_app: 500Mi

#количество ресурсов которые pod может использовать(верхняя граница)

limits_cpu_app: 400m

limits_memory_app: 1000Mi


#имя секрета под которым воркер ноды будут выкачивать образа из gitlab

secret_name_gitlab_login: docker-login-cache-builder
#неймспейс в котором запускаемся

namespace: test-cache-builder


#имя деплоймента

deployment_name: deployment-cache-builder-web


deployment_port: 8080

service_port: 8080


#имя сервиса

service_name: service-cache-builder-web


#имя ingress

ingress_name: ingress-cache-builder-web


#указываем наш домен по которому будет слушать ingress

domain: cb.prod.test.local


#количество реплик деплоймента минимальное количество

replica_number: 1


#имя лейбла сервиса

app_name: cache-builder-web


#имя образа для сервиса

image_app:

  repository: gitnexus.test.local:4567/cache-builder/cache-builder/web

  tag: "v5"


#количество ресурсов которые резервируются для pod на ноде проц и оперативка

requests_cpu_app: 100m

requests_memory_app: 500Mi

#количество ресурсов которые pod может использовать(верхняя граница)

limits_cpu_app: 400m

limits_memory_app: 1000Mi


#имя секрета под которым воркер ноды будут выкачивать образа из gitlab

secret_name_gitlab_login: docker-login-cache-builder
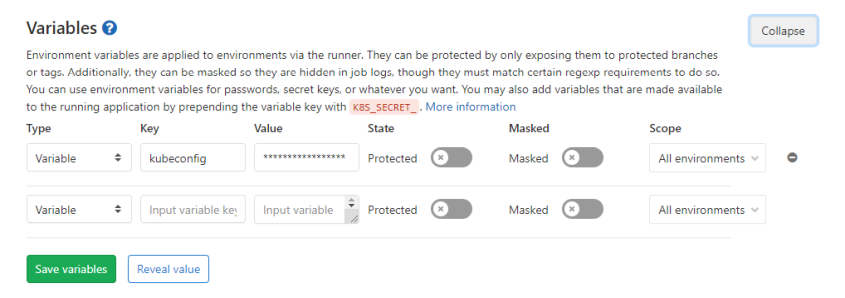
далее показываю .gitlab-ci.yml при котором у меня возникли ошибки:
переменная kubeconfig является токеном кубернетеса добавленным в переменные проекта:
при создании секрета kubectl —kubeconfig=$kubeconfig_url create secret docker-registry docker-login-$CI_PROJECT_NAME —docker-server=$CI_REGISTRY —docker-username=$CI_REGISTRY_USER —docker-password=$CI_REGISTRY_PASSWORD —docker-email=$GITLAB_USER_EMAIL -n $NAMESPACE
под которым дальше будет выкачиваться образ из registry я использовал встроенные переменные: CI_REGISTRY_USER CI_REGISTRY_PASSWORD при их использовании не выкачивается один из образов, вот вывод describe этого pod
Events:

  Type     Reason     Age               From                           Message

  ----     ------     ----              ----                           -------

  Normal   Scheduled  <unknown>         default-scheduler              Successfully assigned test-cache-builder/deployment-cache-builder-node-6f5c998487-gvhbc to prod-srv-kubeworker1

  Normal   BackOff    13s               kubelet, prod-srv-kubeworker1  Back-off pulling image "gitnexus.test.local:4567/cache-builder/cache-builder/node:v14"

  Warning  Failed     13s               kubelet, prod-srv-kubeworker1  Error: ImagePullBackOff

  Normal   Pulling    1s (x2 over 14s)  kubelet, prod-srv-kubeworker1  Pulling image "gitnexus.test.local:4567/cache-builder/cache-builder/node:v14"

  Warning  Failed     1s (x2 over 14s)  kubelet, prod-srv-kubeworker1  Failed to pull image "gitnexus.test.local:4567/cache-builder/cache-builder/node:v14": rpc error: code = Unknown desc = Error response from daemon: Get http://gitnexus.test.local:4567/v2/cache-builder/cache-builder/node/manifests/v14: unauthorized: HTTP Basic: Access denied

  Warning  Failed     1s (x2 over 14s)  kubelet, prod-srv-kubeworker1  Error: ErrImagePull
вылетает ошибка: unauthorized: HTTP Basic: Access denied хотя под этими учётными данными login проходит нормально.
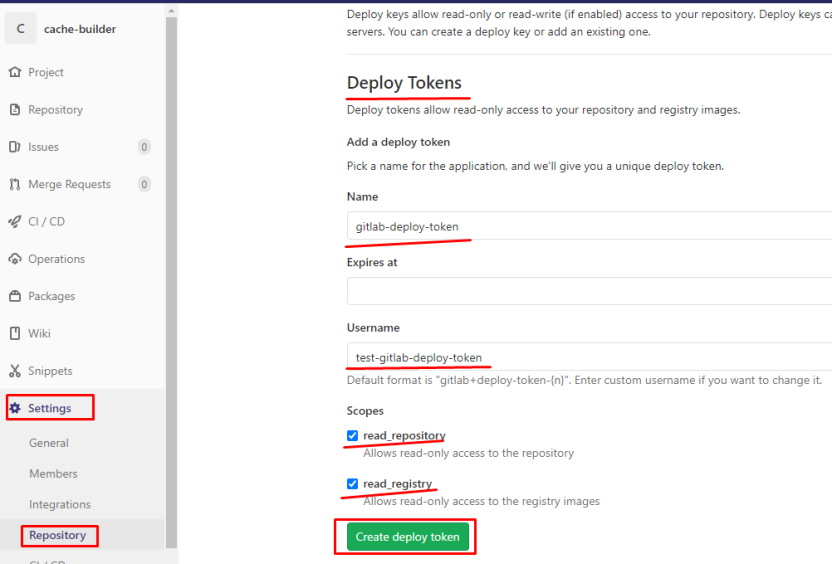
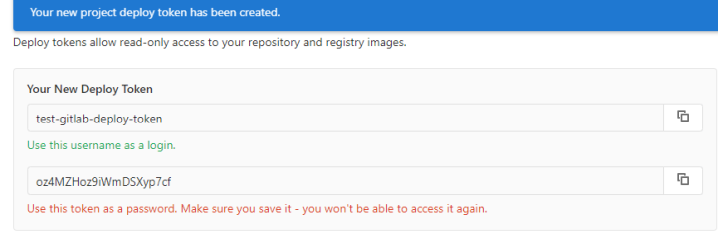
как видим мы изменили CI_REGISTRY_USER на CI_DEPLOY_USER и CI_REGISTRY_PASSWORD на CI_DEPLOY_PASSWORD
в таком варианте стало нормально выкачиваться.
3.Использование условий
Теперь поправим шаблоны, чтобы для некоторых проектов например не ставился ingress, а для других использовались различные livenessProbe и readinessProbe
---

apiVersion: apps/v1

kind: Deployment

metadata:

  name: {{ .Values.deployment_name }}

  namespace: {{ .Values.namespace }}

  labels:

    app: {{ .Values.app_name }}


spec:

  replicas: {{ .Values.replica_number }}

  selector:

    matchLabels:

      app: {{ .Values.app_name }} # по вот этому лейблу репликасет цепляет под

# тут описывается каким мокаром следует обновлять поды

  strategy:

    rollingUpdate:

      maxSurge: 1  # указывает на какое количество реплик можно увеличить

      maxUnavailable: 1 # указывает на какое количество реплик можно уменьшить

#т.е. в одно время при обновлении, будет увеличено на один (новый под) и уменьшено на один (старый под)

    type: RollingUpdate

## тут начинается описание контейнера

  template:

    metadata:

      labels:

        app: {{ .Values.app_name }}  # по вот этому лейблу репликасет цепляет под

#       name_elk: elk-log-{{ .Values.namespace }} #это имя будет записываться в ELK

    spec:

      containers:

        - image: "{{ .Values.image_app.repository }}:{{ .Values.image_app.tag }}"

          imagePullPolicy: Always

          name: {{ .Values.app_name }}

          ports:

            - containerPort: {{ .Values.deployment_port }}

# тут начинаются проверки по доступности

          {{- if .Values.readinessProbe.enabled }}

          readinessProbe: # проверка готово ли приложение

            failureThreshold: {{ .Values.readinessProbe.failureThreshold }} #указывает количество провалов при проверке

            httpGet:  # по сути дёргает курлом на 8080 порт

              path: {{ .Values.readinessProbe.path }}

              port: {{ .Values.readinessProbe.port }}

            periodSeconds: {{ .Values.readinessProbe.periodSeconds }}  #как часто должна проходить проверка (в секундах)

            successThreshold: {{ .Values.readinessProbe.successThreshold }}  #сбрасывает счётчик неудач, т.е. при 3х проверках если 1 раз успешно прошло, то счётчик сбрасывается и всё ок

            timeoutSeconds: {{ .Values.readinessProbe.timeoutSeconds }}  #таймаут на выполнение пробы 1 секунда

            initialDelaySeconds: {{ .Values.readinessProbe.initialDelaySeconds }}

          {{- end}}

          {{- if .Values.livenessProbe.enabled }}

          livenessProbe: #проверка на жизнь приложения, живо ли оно

            failureThreshold: {{ .Values.livenessProbe.failureThreshold }}

            httpGet:

              path: {{ .Values.livenessProbe.path }}

              port: {{ .Values.livenessProbe.port }}

            periodSeconds: {{ .Values.livenessProbe.periodSeconds }}

            successThreshold: {{ .Values.livenessProbe.successThreshold }}

            timeoutSeconds: {{ .Values.livenessProbe.timeoutSeconds }}

            initialDelaySeconds: {{ .Values.livenessProbe.initialDelaySeconds }}  #означает что первую проверку надо сделать только после 10 секунд

          {{- end}}

# тут начинается описание лимитов для пода

          resources:

            requests: #количество ресурсов которые резервируются для pod на ноде

              cpu: {{ .Values.requests_cpu_app }}

              memory: {{ .Values.requests_memory_app }}

            limits: #количество ресурсов которые pod может использовать(верхняя граница)

              cpu: {{ .Values.limits_cpu_app }}

              memory: {{ .Values.limits_memory_app }}

      imagePullSecrets:

      - name: {{ .Values.secret_name_gitlab_login }}
Политика безопасности пода Kubernetes – это ресурс, который контролирует безопасность спецификации этого пода.
Используя определение объекта PodSecurityPolicy, вы можете управлять такими вещами, как:
Возможность запуска привилегированных контейнеров
Повышение привилегий
Доступ к типам томов
Доступ к файловым системам хоста
Использование хост-сети
Как создать политику безопасности пода Kubernetes Давайте создадим политику безопасности пода Kubernetes, которая предотвращает создание привилегированных модулей и контролирует доступ к томам. Во-первых, мы должны создать файл YAML. В терминале введите команду: nano psp.yaml В этот файл вставьте следующее:
Приведенный выше файл создаст роль кластера с именем psp, которая может использовать нашу новую политику, которую мы назвали psp.
Это также создаст привязку роли на уровне кластера, которая предоставляет доступ к роли psp: psp каждому аутентифицированному пользователю.
Сохраните и закройте файл.
Создайте эту политику с помощью команды:
kubectl apply -f rbac-psp.yaml
Теперь мы создали политику и контроль RBAC.
Давайте выясним, сможем ли мы теперь использовать эту новую политику.
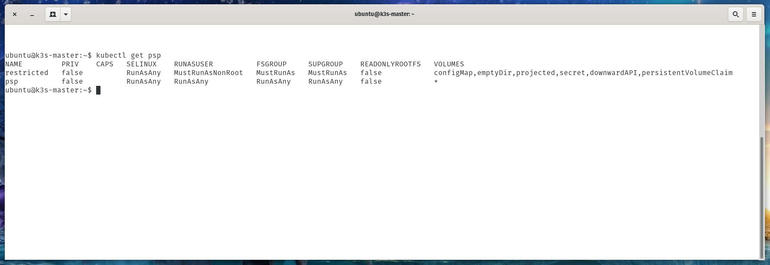
Введите команду:
kubectl auth can-i use psp/psp
Выход должен сказать «yes».
Конечно, система должна сказать «yes», так как я пользователь с правами администратора.
Но что, если мы проверим это с другим пользователем?
Сделайте это с помощью команды:
kubectl auth can-i use psp/psp
Теперь вы должны увидеть «no» в ответе.
Вы только что создали политику безопасности пода Kubernetes, присвоили ей RBAC и протестировали ее, чтобы убедиться, что политика действительно работает.
Kubernetes позволяет автоматически масштабировать приложения (то есть Pod в развертывании или ReplicaSet) декларативным образом с использованием спецификации Horizontal Pod Autoscaler.
По умолчанию критерий для автоматического масштабирования — метрики использования CPU (метрики ресурсов), но можно интегрировать пользовательские метрики и метрики, предоставляемые извне.
Вместо горизонтального автомасштабирования подов, применяется Kubernetes Event Driven Autoscaling (KEDA) — оператор Kubernetes с открытым исходным кодом. Он изначально интегрируется с Horizontal Pod Autoscaler, чтобы обеспечить плавное автомасштабирование (в том числе до/от нуля) для управляемых событиями рабочих нагрузок. Код доступен на GitHub.
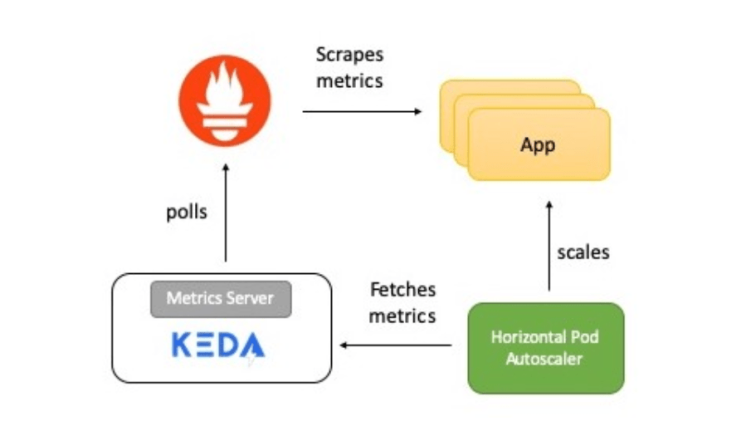
Краткий обзор работы системы
На схеме — краткое описание того, как все работает:
Приложение предоставляет метрики количества обращений к HTTP в формате Prometheus.
Prometheus настроен на сбор этих показателей.
Скейлер Prometheus в KEDA настроен на автоматическое масштабирование приложения на основе количества обращений к HTTP.
Теперь подробно расскажу о каждом элементе.
KEDA и Prometheus
Prometheus — набор инструментов для мониторинга и оповещения систем с открытым исходным кодом, часть Cloud Native Computing Foundation. Собирает метрики из разных источников и сохраняет в виде данных временных рядов. Для визуализации данных можно использовать Grafana или другие инструменты визуализации, работающие с API Kubernetes.
KEDA поддерживает концепцию скейлера — он действует как мост между KEDA и внешней системой. Реализация скейлера специфична для каждой целевой системы и извлекает из нее данные. Затем KEDA использует их для управления автоматическим масштабированием.
Скейлеры поддерживают нескольких источников данных, например, Kafka, Redis, Prometheus. То есть KEDA можно применять для автоматического масштабирования развертываний Kubernetes, используя в качестве критериев метрики Prometheus.
KEDA Prometheus ScaledObject
Скейлер действует как мост между KEDA и внешней системой, из которой нужно получать метрики. ScaledObject — настраиваемый ресурс, его необходимо развернуть для синхронизации развертывания с источником событий, в данном случае с Prometheus.
ScaledObject содержит информацию о масштабировании развертывания, метаданные об источнике события (например, секреты для подключения, имя очереди), интервал опроса, период восстановления и другие данные. Он приводит к соответствующему ресурсу автомасштабирования (определение HPA) для масштабирования развертывания.
Когда объект ScaledObject удаляется, соответствующее ему определение HPA очищается.
Вот определение ScaledObject для нашего примера, в нем используется скейлер Prometheus:
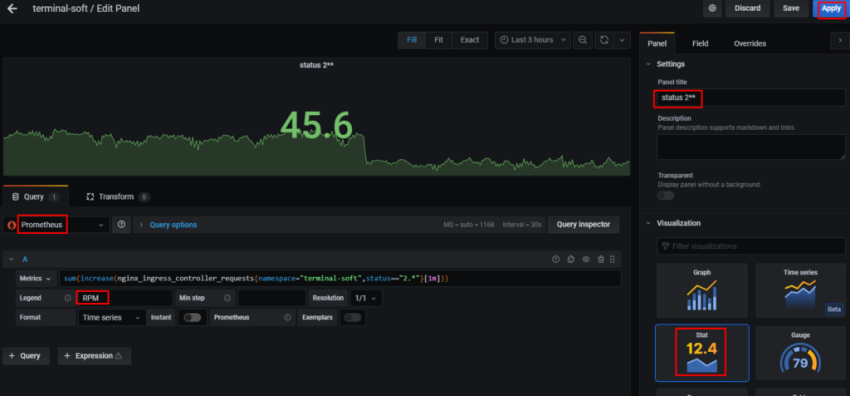
Тип триггера — Prometheus. Адрес сервера Prometheus упоминается вместе с именем метрики, пороговым значением и запросом PromQL, который будет использоваться. Запрос PromQL — sum(rate(http_requests[2m])).
Согласно pollingInterval, KEDA запрашивает цель у Prometheus каждые пятнадцать секунд. Поддерживается минимум один под (minReplicaCount), а максимальное количество подов не превышает maxReplicaCount (в данном примере — десять).
Можно установить minReplicaCount равным нулю. В этом случае KEDA активирует развертывание с нуля до единицы, а затем предоставляет HPA для дальнейшего автоматического масштабирования. Возможен и обратный порядок, то есть масштабирование от единицы до нуля. В примере мы не выбрали ноль, поскольку это HTTP-сервис, а не система по запросу.
Магия внутри автомасштабирования
Пороговое значение используют в качестве триггера для масштабирования развертывания. В нашем примере запрос PromQL sum(rate (http_requests [2m])) возвращает агрегированное значение скорости HTTP-запросов (количество запросов в секунду), ее измеряют за последние две минуты.
Поскольку пороговое значение равно трем, значит, будет один под, пока значение sum(rate (http_requests [2m])) меньше трех. Если же значение возрастает, добавляется дополнительный под каждый раз, когда sum(rate (http_requests [2m])) увеличивается на три. Например, если значение от 12 до 14, то количество подов — четыре.
Теперь давайте попробуем настроить!
Установка KEDA
Вы можете развернуть KEDA несколькими способами, они перечислены в документации. Я использую монолитный YAML:
helm repo add kedacore https://kedacore.github.io/charts helm repo update kubectl create namespace keda helm install keda kedacore/keda —namespace keda
я ставил через монолитный файл. проверим что всё поднялось:
[root@kub-master-1 ~]# kubectl get all -n keda

NAME                                          READY   STATUS    RESTARTS   AGE

pod/keda-metrics-apiserver-57cbdb849f-w7rfg   1/1     Running   0          70m

pod/keda-operator-58cb545446-5rblj            1/1     Running   0          70m


NAME                             TYPE        CLUSTER-IP      EXTERNAL-IP   PORT(S)          AGE

service/keda-metrics-apiserver   ClusterIP   10.100.134.31   <none>        443/TCP,80/TCP   70m


NAME                                     READY   UP-TO-DATE   AVAILABLE   AGE

deployment.apps/keda-metrics-apiserver   1/1     1            1           70m

deployment.apps/keda-operator            1/1     1            1           70m


NAME                                                DESIRED   CURRENT   READY   AGE

replicaset.apps/keda-metrics-apiserver-57cbdb849f   1         1         1       70m

replicaset.apps/keda-operator-58cb545446            1         1         1       70m
3. Пример работы
создаём namespace
kubectl create ns my-site
запускаем обычное приложение например apache:
[root@kub-master-1 ~]# cat my-site.yaml
---

apiVersion: apps/v1

kind: Deployment

metadata:

  name: my-deployment-apache

  namespace: my-site

spec:

  replicas: 1

  selector:

    matchLabels:

      app: apache # по вот этому лейблу репликасет цепляет под

# тут описывается каким мокаром следует обновлять поды

  strategy:

    rollingUpdate:

      maxSurge: 1  # указывает на какое количество реплик можно увеличить

      maxUnavailable: 1 # указывает на какое количество реплик можно уменьшить

#т.е. в одно время при обновлении, будет увеличено на один (новый под) и уменьшено на один (старый под)

    type: RollingUpdate

## тут начинается описание контейнера

  template:

    metadata:

      labels:

        app: apache  # по вот этому лейблу репликасет цепляет под

    spec:

      containers:

        - image: httpd:2.4.43

          name: apache

          ports:

            - containerPort: 80

# тут начинаются проверки по доступности

          readinessProbe: # проверка готово ли приложение

            failureThreshold: 3 #указывает количество провалов при проверке

            httpGet:  # по сути дёргает курлом на 80 порт

              path: /

              port: 80

            periodSeconds: 10 #как часто должна проходить проверка (в секундах)

            successThreshold: 1 #сбрасывает счётчик неудач, т.е. при 3х проверках если 1 раз успешно прошло, то счётчик сбрасывается и всё ок

            timeoutSeconds: 1 #таймаут на выполнение пробы 1 секунда

          livenessProbe: #проверка на жизнь приложения, живо ли оно

            failureThreshold: 3

            httpGet:

              path: /

              port: 80

            periodSeconds: 10

            successThreshold: 1

            timeoutSeconds: 1

            initialDelaySeconds: 10 #означает что первую проверку надо сделать только после 10 секунд


# тут начинается описание лимитов для пода

          resources:

            requests: #количество ресурсов которые резервируются для pod на ноде

              cpu: 60m

              memory: 200Mi

            limits: #количество ресурсов которые pod может использовать(верхняя граница)

              cpu: 120m

              memory: 300Mi
[root@kub-master-1 ~]# cat my-site-service.yaml
---

apiVersion: v1

kind: Service

metadata:

  name: my-service-apache # имя сервиса

  namespace: my-site

spec:

  ports:

  - port: 80  # принимать на 80

    targetPort: 80 # отправлять на 80

  selector:

    app: apache  #отправлять на все поды с данным лейблом

  type: ClusterIP
[root@kub-master-1 ~]# cat my-site-ingress.yaml
---

apiVersion: extensions/v1beta1

kind: Ingress

metadata:

  name: my-ingress

  namespace: my-site

spec:

  rules:

  - host: test.ru  #тут указывается наш домен

    http:

      paths:  #список путей которые хотим обслуживать(он дефолтный и все запросы будут отпаврляться на бэкенд, т.е. на сервис my-service-apache)

      - backend:

          serviceName: my-service-apache  #тут указывается наш сервис

          servicePort: 80 #порт на котором сервис слушает

#        path: /  все запросы на корень '/' будут уходить на наш сервис
NAME                                        READY   STATUS    RESTARTS   AGE

pod/my-deployment-apache-859486bd8c-k6bql   1/1     Running   0          20m


NAME                        TYPE        CLUSTER-IP       EXTERNAL-IP   PORT(S)   AGE

service/my-service-apache   ClusterIP   10.100.255.190   <none>        80/TCP    20m


NAME                                   READY   UP-TO-DATE   AVAILABLE   AGE

deployment.apps/my-deployment-apache   1/1     1            1           20m


NAME                                              DESIRED   CURRENT   READY   AGE

replicaset.apps/my-deployment-apache-859486bd8c   1         1         1       20m
будем автоскейлить — для примера по метрике nginx nginx_ingress_controller_requests
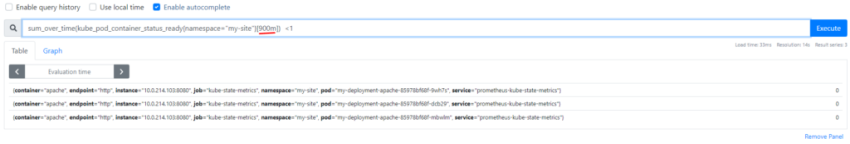
запрос в prometheus будет следующий:
sum(irate( nginx_ingress_controller_requests{namespace=»my-site»}[3m] )) by (ingress)*10
т.е. считаем общее количество запросов в неймспейс my-site за 3 минуты
тут мы указываем в каком namespace нам запускаться: namespace: my-site
указываем цель, т.е. наш deployment: name: my-deployment-apache
задаём минимальное и максимальное количество реплик minReplicaCount: 1 # значение по умолчанию: 0 maxReplicaCount: 8 # значение по умолчанию: 100
есть ещё 2 стандартные переменные отвечающие за то когда поды будут подыматься и убиваться: pollingInterval: 30 # Optional. Default: 30 seconds cooldownPeriod: 300 # Optional. Default: 300 seconds
указываем адрес нашего prometheus
serverAddress: http://prometheus-kube-prometheus-prometheus.monitoring.svc.cluster.local:9090 адрес идёт в виде сервис.неймспейс.svc.имя_кластера
Harbor – это облачный реестр с открытым исходным кодом, который хранит, подписывает и сканирует образы контейнеров на наличие уязвимостей.
Это руководство покажет вам как установить Harbor Image Registry в Kubernetes / OpenShift с помощью чарта Helm.
Вот некоторые из интересных особенностей реестра образов Harbour:
Особенности Harbour
Поддержка Multi-tenant
Поддержка анализа безопасности и уязвимостей
Расширяемый API и веб-интерфейс
Подписание и проверка контента
Репликация образов в нескольких экземплярах Harbour
Интеграция и контроль доступа на основе ролей
Helm – это инструмент интерфейса командной строки (CLI), созданный для упрощения развертывания приложений и сервисов в кластерах Kubernetes / OpenShift
Helm использует формат упаковки, называемый чартами.
Чарт Helm – это набор файлов, описывающих ресурсы Kubernetes.
Шаг 1: Установка Helm 3 на Linux / macOS
Helm имеет бинарник, что означает, что для его установки на вашем компьютере Linux / macOS не требуется никаких зависимостей:
Шаг 2: Установите чарт Harbor в Kubernetes / OpenShift кластере
Чарт – это пакет Helm.
Он содержит все определения ресурсов, необходимые для запуска приложения, инструмента или службы внутри кластера Kubernetes.
Добавьте репозиторий Harbour Helm:
$ helm repo add harbor https://helm.goharbor.io

"harbor" has been added to your repositories
Обновите репозиторий:
$ helm repo update
Настройка чарта
Элементы конфигурации могут быть установлены с помощью флага –set во время установки или настроены путем непосредственного редактирования values.yaml.
Вы можете скачать файл values.yaml по умолчанию.
wget https://raw.githubusercontent.com/goharbor/harbor-helm/master/values.yaml

vim values.yaml
Установите чарт Harbor с пользовательскими настройками после внесения изменений.
$ helm install harbor harbor/harbor -f values.yaml -n harbor

NAME: harbor

LAST DEPLOYED: Wed Apr  1 19:20:07 2020

NAMESPACE: harbor

STATUS: deployed

REVISION: 1

TEST SUITE: None

NOTES:

Please wait for several minutes for Harbor deployment to complete.

Then you should be able to visit the Harbor portal at https://hbr.apps.hqocp.safaricom.net.

For more details, please visit https://github.com/goharbor/harbor.
Проверьте статус, чтобы подтвердить его развертывание:
$ helm status harbor
Исправление инициализации:CrashLoopBackOff в поде harbor-harbor-database на OpenShift
Некоторые образы контейнеров, такие как postgres и redis, требуют рутового доступа и имеют определенные ожидания относительно владения томами.
Нам нужно ослабить безопасность в кластере, чтобы образы не запускались как предварительно выделенный UID, не предоставляя всем доступ к привилегированному SCC:
Предоставьте всем аутентифицированным пользователям доступ к anyuid SCC:
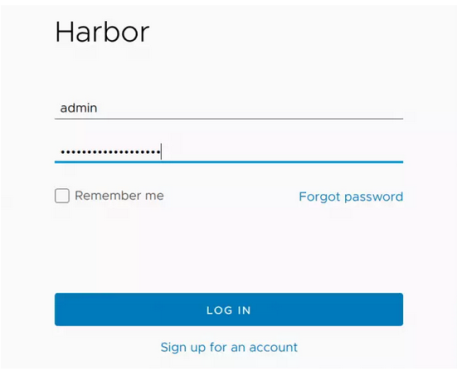
Используйте внешний домен, настроенный во время установки, для доступа к панели мониторинга реестра контейнера Harbour.
Креды по умолчанию:
Username: admin Password: Harbor12345
использовать Harbor для сканирования образов Docker на наличие уязвимостей
Harbor – это локальный реестр Docker, который, будучи собранным с поддержкой Clair, позволяет сканировать спушенные образы на наличие известных уязвимостей.
Это должно считаться обязательным в компаниях, которые полагаются на контейнеры.
Но как использовать Harbour для сканирования этих образов?
Давайте посмотрим.
Что вам нужно
Самое главное, вам понадобится это Harbor (с поддержкой Clair).
Вам также понадобятся образа для отправки на сервер Harbor и учетную запись пользователя на сервере Harbour.
Сертификаты
Если вы планируете передавать образы с компьютеров в вашей сети (которые не являются вашим сервером Harbour), вам необходимо скопировать сертификаты с сервера Harbour на клиенты.
Если вы следовали инструкциям по установке Harbor, возможно, вы используете самозаверенные сертификаты.
Я собираюсь предположить, что это так.
И так … вот как скопировать эти сертификаты с сервера на клиент:
подключитесь по ssh (или войдите в консоль) к серверу Harbor.
Получите root-доступ с помощью команды sudo -s.
Перейдите в каталог сертификатов с помощью команды cd /etc/docker/certs.d/SERVER_IP (где SERVER_IP – это IP-адрес вашего сервера).
Скопируйте ключ ca.cert на клиент с помощью команды scp ca.cert USER @ CLIENT_IP: / home / USER (где USER – имя пользователя на клиентском компьютере, а CLIENT_IP – IP-адрес клиентского компьютера).
Скопируйте ключ ca.crt на клиент с помощью команды scp ca.crt USER @ CLIENT_IP: / home / USER (где USER – это имя пользователя на клиентском компьютере, а CLIENT_IP – это IP-адрес клиентского компьютера).
Скопируйте клиентский ключ ca.key с помощью команды scp ca.key USER @ CLIENT_IP: / home / USER (где USER – это имя пользователя на клиентском компьютере, а CLIENT_IP – это IP-адрес клиентского компьютера).
SSH к клиентскому компьютеру с помощью команды ssh USER @ CLIENT_IP (где USER – имя пользователя на клиентском компьютере, а CLIENT_IP – IP-адрес клиентского компьютера).
Создайте новый каталог сертификатов с помощью команды sudo mkdir -p /etc/docker/certs.d/SERVER_IP (где SERVER_IP – это IP-адрес сервера Harbour).
Скопируйте файлы с помощью команды sudo cp ca. * /etc/docker/certs.d/SERVER_IP (где SERVER_IP – IP-адрес сервера Harbor).
Теперь ваш клиент должен иметь возможность войти в репозиторий Harbor и отправлять образы.
Пометка образов ( теги )
Прежде чем отправить образ с клиента на сервер, сначала необходимо пометить его.
Допустим, у вас есть официальный образ Ubuntu, и вы хотите пометить его конкретным именем разработчика.
Чтобы пометить его так, чтобы его можно было перенести в реестр Harbor, команда tag будет выглядеть так:
docker tag ubuntu SERVER_IP/PROJECT_NAME/ubuntu:DEVNAME
Где:
SERVER_IP – это IP-адрес сервера Harbour.
PROJECT_NAME – это имя проекта на сервере Harbour.
DEVNAME: имя разработчика, которого вы хотите пометить.
Таким образом, команда может выглядеть так:
docker tag ubuntu 192.168.1.75/test/ubuntu:jack
Пушинг образа
Сначала вы должны войти в реестр на сервере Harbor.
Для этого выполните команду:
docker login SERVER_IP
Где SERVER_IP – это IP-адрес сервера Harbor.
Вам будет предложено ввести имя пользователя и пароль пользователя на сервере Harbour.
После входа в систему вы можете спушить образ с помощью команды:
docker push 192.168.1.75/test/ubuntu:jack
После завершения вы готовы отсканировать образ на наличие уязвимостей.
Сканирование образа
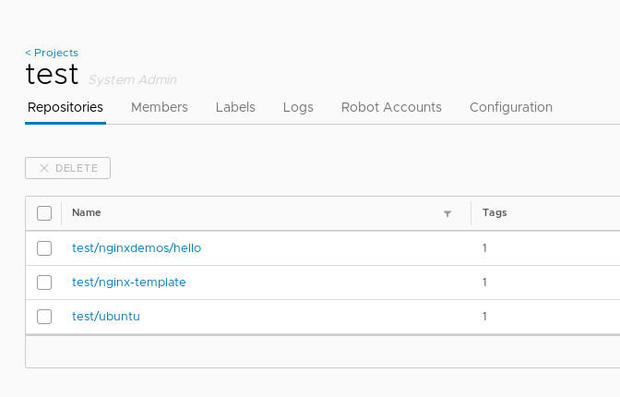
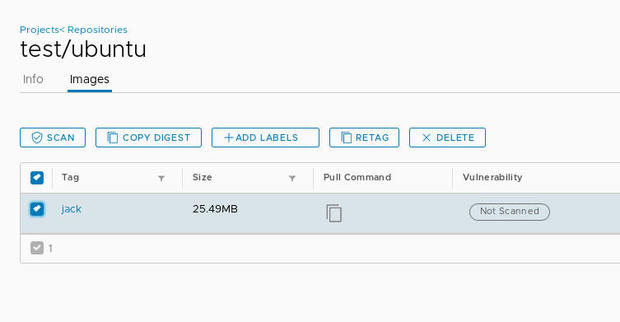
Войдите в свой реестр Harbor и перейдите к проекту, в котором размещен недавно подтянутый образ
Вы должны увидеть образ в списке:
Created with GIMP
Щелкните на новый образ и в появившемся окне установите флажок, связанный с тегом образа.
После выбора нажмите кнопку SCAN, чтобы начать сканирование.
Created with GIMP
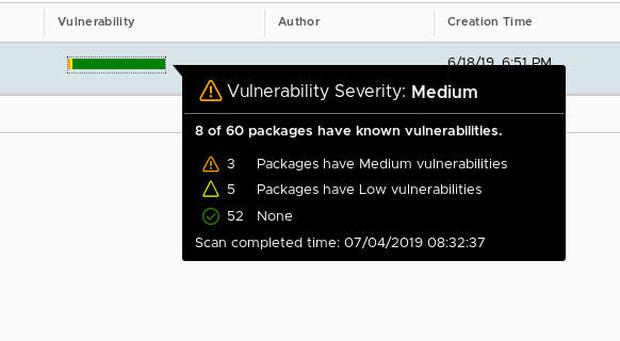
Когда сканирование завершится, вы увидите полосу, представляющую результаты сканирования.
Наведите курсор на эту полосу, чтобы просмотреть отчет:
Created with GIMP
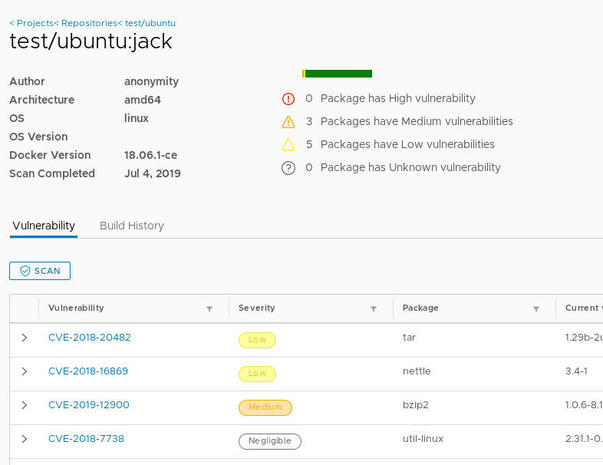
Если вы нажмете на имя тега, вы увидите полный отчет, в котором представлены полные результаты, включая CVE для каждой уязвимости:
Created with GIMP
Прокрутите весь отчет, чтобы просмотреть все уязвимости.
Если вы обнаружите, что образ содержит слишком много общих уязвимостей или достаточно средних или высоких уязвимостей, я предлагаю не использовать его.
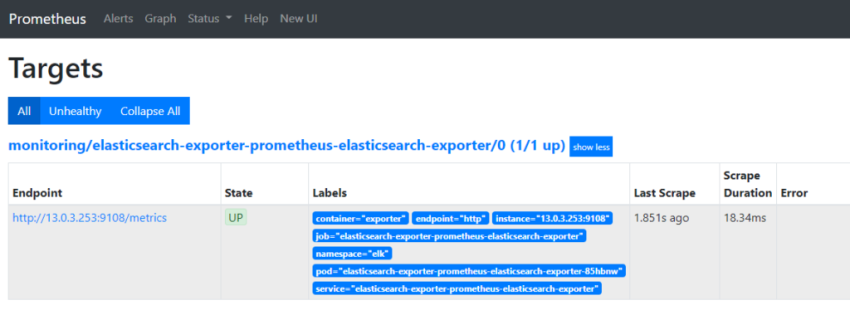
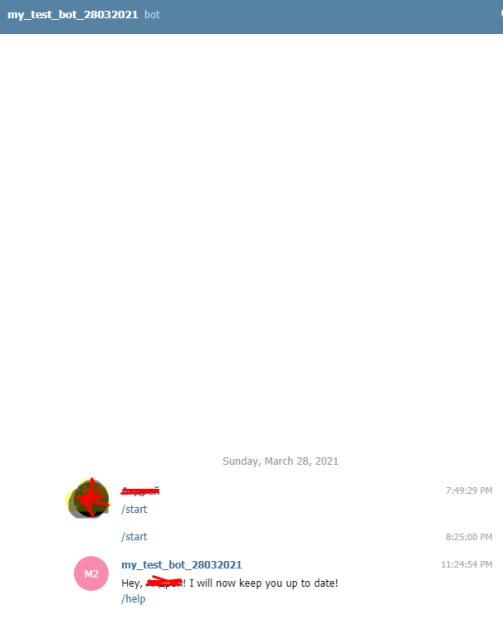
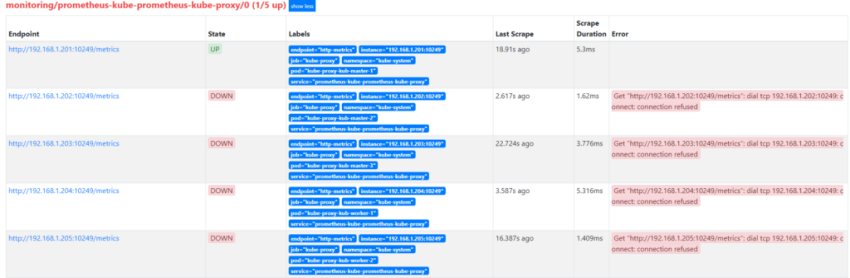
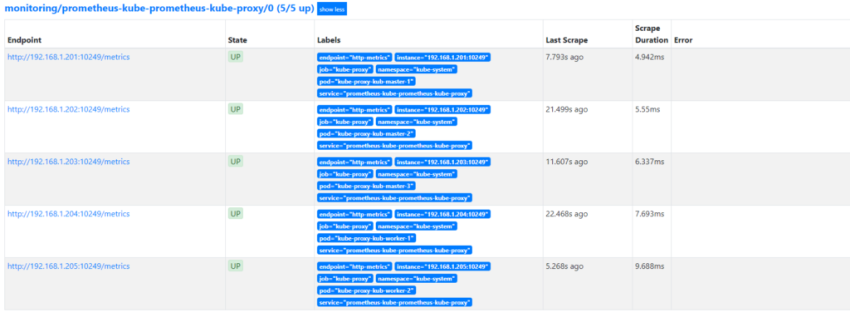
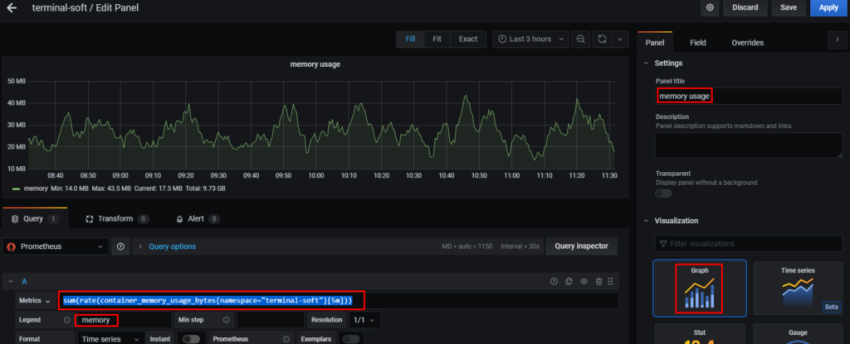
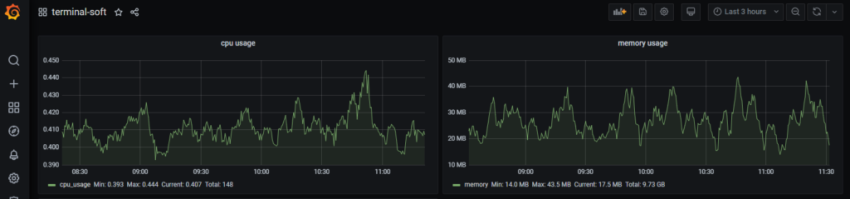
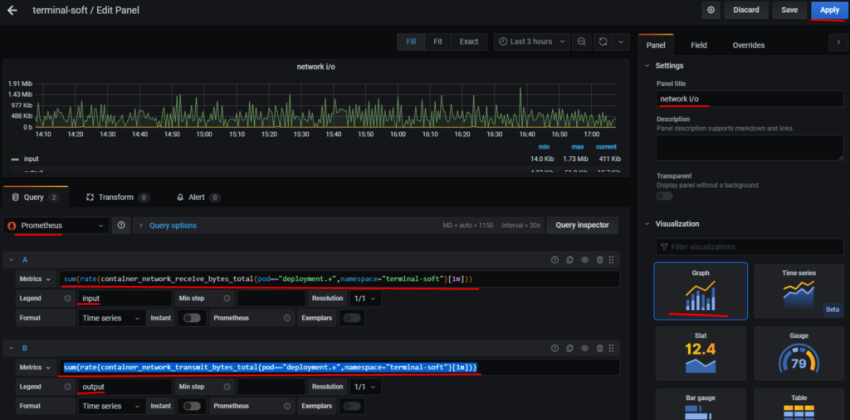
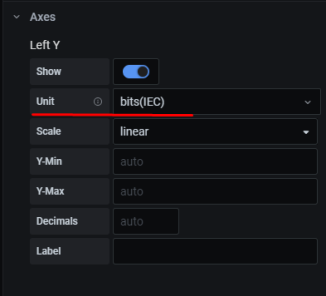
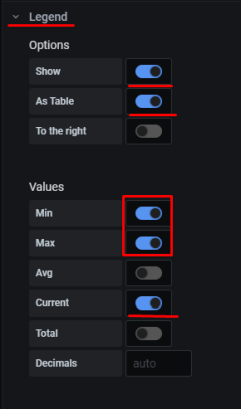
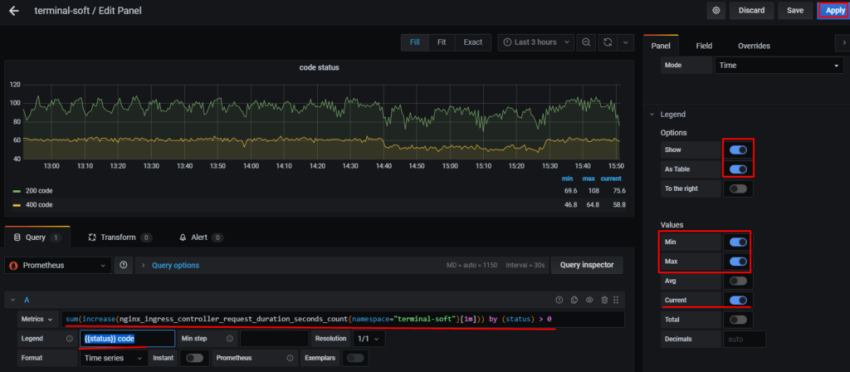
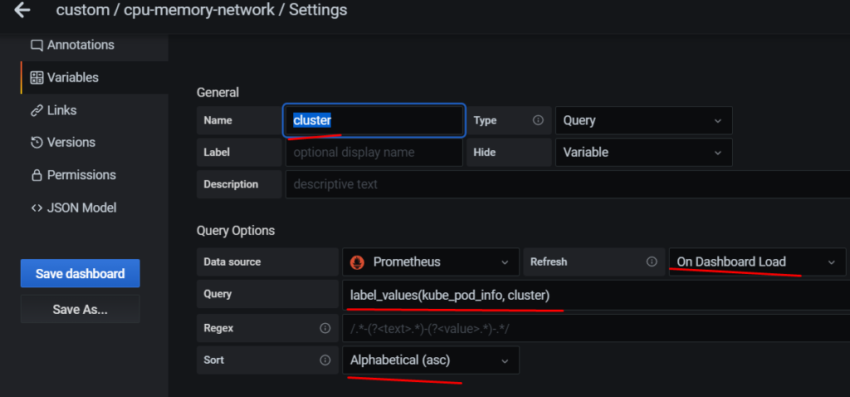
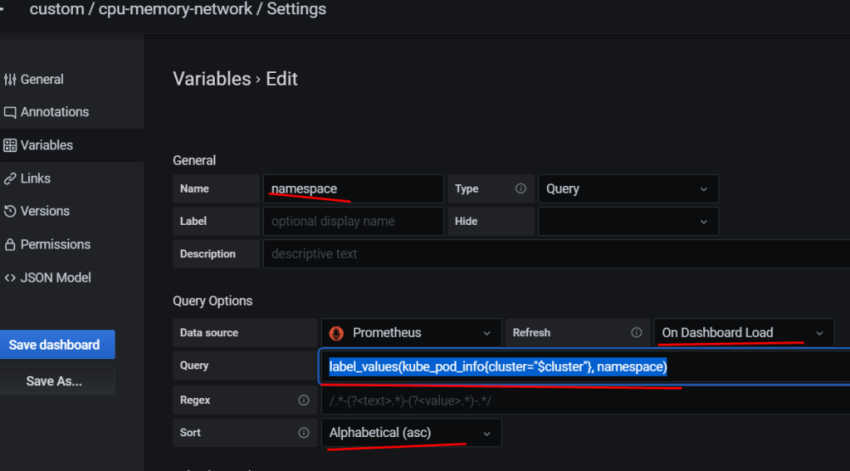
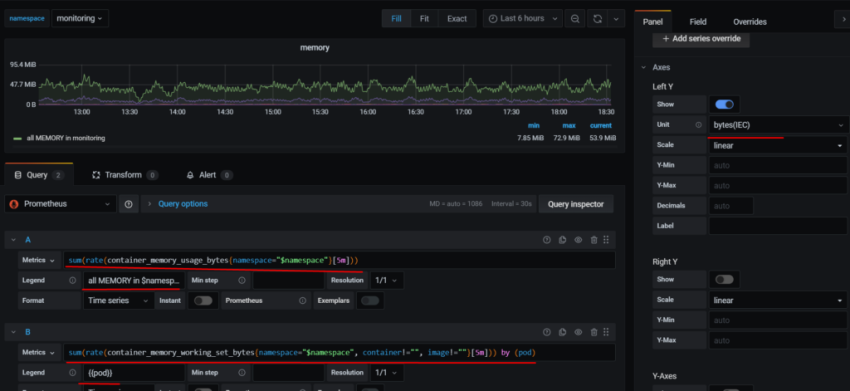
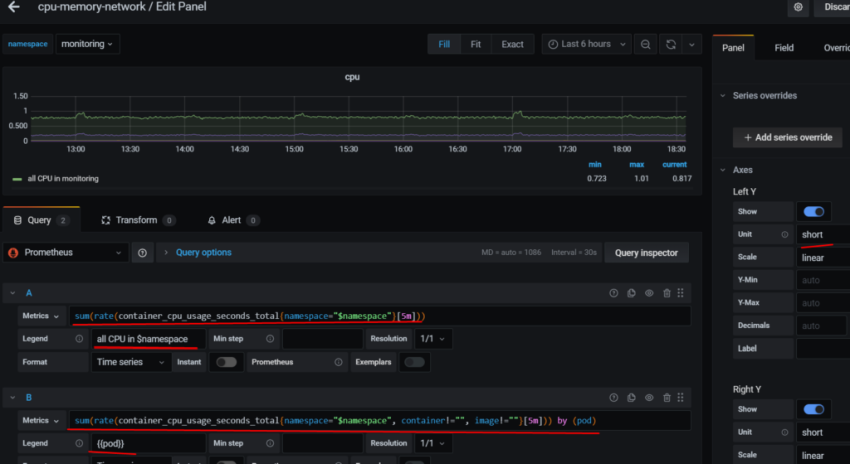
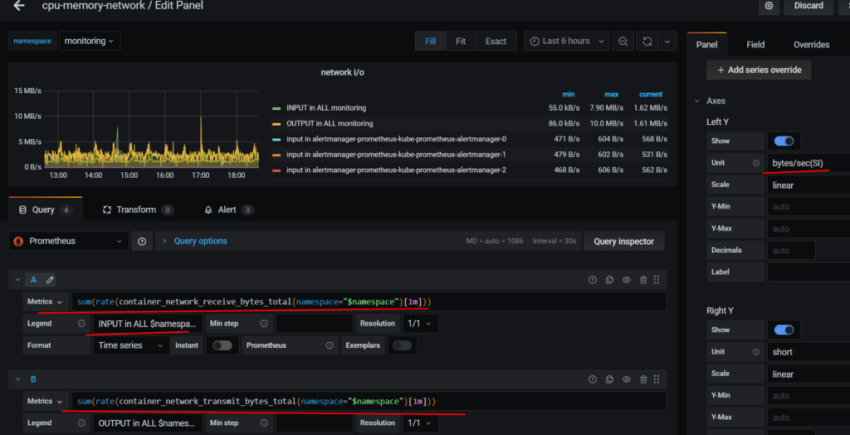
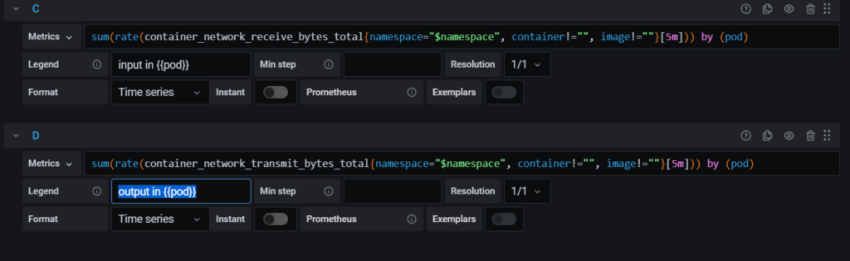
1.Установка prometheus 2.exporter nginx(ingress-controller) 3.exporter elasticsearch 4.exporter rabbitmq 5.exporter redis 6.настройка оповещений в telegram 6.1 настройка оповещений в telegram в различные чаты(группы) 6.2. настройка оповещений в telegram разграничение оповещений по группам (исключения уведомлений) 7.Проблема с prometheus-kube-proxy 8.Настройка алерта для определённого неймспейса 9.Добавление оповещений и по email 10. Настройка графиков в grafana
Качаем репозиторий
git clone https://github.com/prometheus-community/helm-charts.git cd helm-charts/charts/kube-prometheus-stack/ докачиваем чарты: helm dep update
создаём namescpase в котором будет всё крутиться: kubectl create ns monitoring
теперь рассмотрим что правим в переменных у helm chart:
[root@prod-vsrv-kubemaster1 charts]# vim kube-prometheus-stack/values.yaml
тут указываем ingress а также добавляем хранение dashboard в nfs storage-class
grafana:

  enabled: true

  namespaceOverride: "monitoring"

  ## Deploy default dashboards.

  ##

  defaultDashboardsEnabled: true

  adminPassword: prom-operator

  ingress:

    ## If true, Grafana Ingress will be created

    ##

    enabled: true

     labels: {}

    ## Hostnames.

    ## Must be provided if Ingress is enable.

    ##

    hosts:

      - grafana.prod.test.local

    #hosts: []

    ## Path for grafana ingress

    path: /

    ## TLS configuration for grafana Ingress

    ## Secret must be manually created in the namespace

    ##

    tls: []

    # - secretName: grafana-general-tls

    #   hosts:

    #   - grafana.example.com

  persistence:

    type: pvc

    enabled: true

    storageClassName: nfs-storageclass

    accessModes:

      - ReadWriteMany

    size: 5Gi

    # annotations: {}

    finalizers:

      - kubernetes.io/pvc-protection
  ## If using kubeControllerManager.endpoints only the port and targetPort are used

  ##

  service:

    port: 10252

    targetPort: 10252

    selector:

      k8s-app: kube-controller-manager

    #   component: kube-controller-manager
  ## If using kubeScheduler.endpoints only the port and targetPort are used

  ##

  service:

    port: 10251

    targetPort: 10251

    selector:

      k8s-app: kube-scheduler

    #   component: kube-scheduler
## Configuration for prometheus-node-exporter subchart
##
prometheus-node-exporter:
namespaceOverride: "monitoring"
теперь настраиваем ingress для prometheus
ingress:
enabled: true
annotations: {}
labels: {}
## Hostnames.
## Must be provided if Ingress is enabled.
##
hosts:
- prometheus.prod.test.local
## Paths to use for ingress rules -
##
paths:
- /
и теперь важная фишка, добавление label который надо будет добавить на все неймспейсы:
## Namespaces to be selected for ServiceMonitor discovery.
##
serviceMonitorNamespaceSelector:
matchLabels:
prometheus: enabled
## Log level for Alertmanager to be configured with.
##
logLevel: info
## Size is the expected size of the alertmanager cluster. The controller will eventually make the size of the
## running cluster equal to the expected size.
replicas: 3
также правим:
## Enable scraping /metrics/resource from kubelet's service
## This is disabled by default because container metrics are already exposed by cAdvisor
##
resource: true
для выставления срока хранения данных можем поменять следующее значение:
## Time duration Alertmanager shall retain data for. Default is '120h', and must match the regular expression
## [0-9]+(ms|s|m|h) (milliseconds seconds minutes hours).
##
retention: 120h
Release "prometheus" does not exist. Installing it now.
NAME: prometheus
LAST DEPLOYED: Thu Mar 4 13:25:07 2021
NAMESPACE: monitoring
STATUS: deployed
REVISION: 1
NOTES:
kube-prometheus-stack has been installed. Check its status by running:
kubectl --namespace monitoring get pods -l "release=prometheus"
Visit https://github.com/prometheus-operator/kube-prometheus for instructions on how to create & configure Alertmanager and Prometheus instances using the Operator.
видим что при запуске добавился label release=prometheus — проверяем: kubectl describe pod prometheus-kube-prometheus-operator-659d5f8674-qxrf5 -n monitoring | grep -i release release=prometheus
смотрим label на всех неймсмейсах: kubectl get ns —show-labels
NAME STATUS AGE LABELS
default Active 192d <none>
elk Active 63d <none>
ingress-nginx Active 192d name=ingress-nginx
keda Active 86d <none>
kube-node-lease Active 192d <none>
kube-public Active 192d <none>
kube-system Active 192d name=kube-system
m-logstash-megabuilder Active 12d <none>
monitoring Active 3h15m <none>
terminal-soft Active 176d <none>
проставим на них label release=prometheus kubectl label namespace —all «prometheus=enabled»
проверяем: kubectl get ns —show-labels
NAME STATUS AGE LABELS
default Active 192d prometheus=enabled
elk Active 63d prometheus=enabled
ingress-nginx Active 192d name=ingress-nginx,prometheus=enabled
keda Active 86d prometheus=enabled
kube-node-lease Active 192d prometheus=enabled
kube-public Active 192d prometheus=enabled
kube-system Active 192d name=kube-system,prometheus=enabled
m-logstash-megabuilder Active 12d prometheus=enabled
monitoring Active 3h16m prometheus=enabled
terminal-soft Active 176d prometheus=enabled
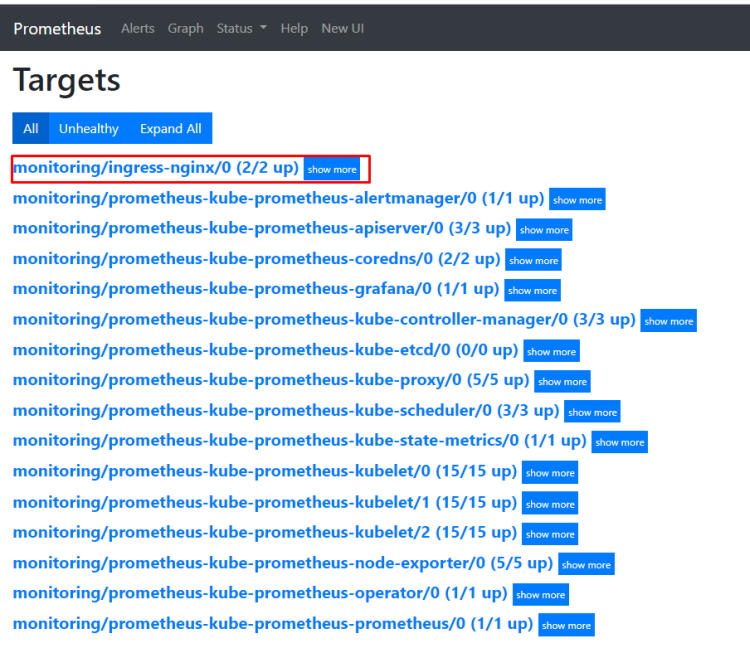
теперь настроим сбор метрик с ingress controller,
создаём сервис для ingress. Указываем namespace в котором работает ingress, так же необходим label app.kubernetes.io/name: ingress-nginx данный лейб смотрим так: kubectl describe pod -n ingress-nginx ingress-nginx-controller-vqjkl | grep -A3 Labels
## Enable scraping /metrics/resource from kubelet's service
## This is disabled by default because container metrics are already exposed by cAdvisor
##
resource: true
# Default values for kube-prometheus-stack.
# This is a YAML-formatted file.
# Declare variables to be passed into your templates.
## Provide a name in place of kube-prometheus-stack for `app:` labels
##
nameOverride: ""
## Override the deployment namespace
##
namespaceOverride: "monitoring"
## Provide a k8s version to auto dashboard import script example: kubeTargetVersionOverride: 1.16.6
##
kubeTargetVersionOverride: ""
## Provide a name to substitute for the full names of resources
##
fullnameOverride: ""
## Labels to apply to all resources
##
commonLabels: {}
# scmhash: abc123
# myLabel: aakkmd
## Create default rules for monitoring the cluster
##
defaultRules:
create: true
rules:
alertmanager: true
etcd: true
general: true
k8s: true
kubeApiserver: true
kubeApiserverAvailability: true
kubeApiserverError: true
kubeApiserverSlos: true
kubelet: true
kubePrometheusGeneral: true
kubePrometheusNodeAlerting: true
kubePrometheusNodeRecording: true
kubernetesAbsent: true
kubernetesApps: true
kubernetesResources: true
kubernetesStorage: true
kubernetesSystem: true
kubeScheduler: true
kubeStateMetrics: true
network: true
node: true
prometheus: true
prometheusOperator: true
time: true
## Runbook url prefix for default rules
runbookUrl: https://github.com/kubernetes-monitoring/kubernetes-mixin/tree/master/runbook.md#
## Reduce app namespace alert scope
appNamespacesTarget: ".*"
## Labels for default rules
labels: {}
## Annotations for default rules
annotations: {}
## Additional labels for PrometheusRule alerts
additionalRuleLabels: {}
## Deprecated way to provide custom recording or alerting rules to be deployed into the cluster.
##
# additionalPrometheusRules: []
# - name: my-rule-file
# groups:
# - name: my_group
# rules:
# - record: my_record
# expr: 100 * my_record
## Provide custom recording or alerting rules to be deployed into the cluster.
##
additionalPrometheusRulesMap: {}
# rule-name:
# groups:
# - name: my_group
# rules:
# - record: my_record
# expr: 100 * my_record
##
global:
rbac:
create: true
pspEnabled: true
pspAnnotations: {}
## Specify pod annotations
## Ref: https://kubernetes.io/docs/concepts/policy/pod-security-policy/#apparmor
## Ref: https://kubernetes.io/docs/concepts/policy/pod-security-policy/#seccomp
## Ref: https://kubernetes.io/docs/concepts/policy/pod-security-policy/#sysctl
##
# seccomp.security.alpha.kubernetes.io/allowedProfileNames: '*'
# seccomp.security.alpha.kubernetes.io/defaultProfileName: 'docker/default'
# apparmor.security.beta.kubernetes.io/defaultProfileName: 'runtime/default'
## Reference to one or more secrets to be used when pulling images
## ref: https://kubernetes.io/docs/tasks/configure-pod-container/pull-image-private-registry/
##
imagePullSecrets: []
# - name: "image-pull-secret"
## Configuration for alertmanager
## ref: https://prometheus.io/docs/alerting/alertmanager/
##
alertmanager:
## Deploy alertmanager
##
enabled: true
## Api that prometheus will use to communicate with alertmanager. Possible values are v1, v2
##
apiVersion: v2
## Service account for Alertmanager to use.
## ref: https://kubernetes.io/docs/tasks/configure-pod-container/configure-service-account/
##
serviceAccount:
create: true
name: ""
annotations: {}
## Configure pod disruption budgets for Alertmanager
## ref: https://kubernetes.io/docs/tasks/run-application/configure-pdb/#specifying-a-poddisruptionbudget
## This configuration is immutable once created and will require the PDB to be deleted to be changed
## https://github.com/kubernetes/kubernetes/issues/45398
##
podDisruptionBudget:
enabled: false
minAvailable: 1
maxUnavailable: ""
## Alertmanager configuration directives
## ref: https://prometheus.io/docs/alerting/configuration/#configuration-file
## https://prometheus.io/webtools/alerting/routing-tree-editor/
##
config:
global:
resolve_timeout: 5m
route:
receiver: 'telegram'
routes:
- match:
severity: critical
repeat_interval: 48h
continue: true
receiver: 'telegram'
- match:
alertname: Watchdog
repeat_interval: 48h
continue: true
receiver: 'telegram'
receivers:
- name: 'telegram'
webhook_configs:
- send_resolved: true
url: 'http://alertmanager-bot:8080'
# config:
# global:
# resolve_timeout: 5m
# route:
# group_by: ['job']
# group_wait: 30s
# group_interval: 5m
# repeat_interval: 12h
# receiver: 'null'
# routes:
# - match:
# alertname: Watchdog
# receiver: 'null'
# receivers:
# - name: 'null'
templates:
- '/etc/alertmanager/config/*.tmpl'
## Pass the Alertmanager configuration directives through Helm's templating
## engine. If the Alertmanager configuration contains Alertmanager templates,
## they'll need to be properly escaped so that they are not interpreted by
## Helm
## ref: https://helm.sh/docs/developing_charts/#using-the-tpl-function
## https://prometheus.io/docs/alerting/configuration/#tmpl_string
## https://prometheus.io/docs/alerting/notifications/
## https://prometheus.io/docs/alerting/notification_examples/
tplConfig: false
## Alertmanager template files to format alerts
## By default, templateFiles are placed in /etc/alertmanager/config/ and if
## they have a .tmpl file suffix will be loaded. See config.templates above
## to change, add other suffixes. If adding other suffixes, be sure to update
## config.templates above to include those suffixes.
## ref: https://prometheus.io/docs/alerting/notifications/
## https://prometheus.io/docs/alerting/notification_examples/
##
templateFiles: {}
#
## An example template:
# template_1.tmpl: |-
# {{ define "cluster" }}{{ .ExternalURL | reReplaceAll ".*alertmanager\.(.*)" "$1" }}{{ end }}
#
# {{ define "slack.myorg.text" }}
# {{- $root := . -}}
# {{ range .Alerts }}
# *Alert:* {{ .Annotations.summary }} - `{{ .Labels.severity }}`
# *Cluster:* {{ template "cluster" $root }}
# *Description:* {{ .Annotations.description }}
# *Graph:* <{{ .GeneratorURL }}|:chart_with_upwards_trend:>
# *Runbook:* <{{ .Annotations.runbook }}|:spiral_note_pad:>
# *Details:*
# {{ range .Labels.SortedPairs }} • *{{ .Name }}:* `{{ .Value }}`
# {{ end }}
# {{ end }}
# {{ end }}
ingress:
enabled: true
# For Kubernetes >= 1.18 you should specify the ingress-controller via the field ingressClassName
# See https://kubernetes.io/blog/2020/04/02/improvements-to-the-ingress-api-in-kubernetes-1.18/#specifying-the-class-of-an-ingress
# ingressClassName: nginx
annotations: {}
labels: {}
## Hosts must be provided if Ingress is enabled.
##
hosts:
- alertmanager.prod.test.local
## Paths to use for ingress rules - one path should match the alertmanagerSpec.routePrefix
##
paths:
- /
## For Kubernetes >= 1.18 you should specify the pathType (determines how Ingress paths should be matched)
## See https://kubernetes.io/blog/2020/04/02/improvements-to-the-ingress-api-in-kubernetes-1.18/#better-path-matching-with-path-types
# pathType: ImplementationSpecific
## TLS configuration for Alertmanager Ingress
## Secret must be manually created in the namespace
##
tls: []
# - secretName: alertmanager-general-tls
# hosts:
# - alertmanager.example.com
## Configuration for Alertmanager secret
##
secret:
annotations: {}
## Configuration for creating an Ingress that will map to each Alertmanager replica service
## alertmanager.servicePerReplica must be enabled
##
ingressPerReplica:
enabled: false
# For Kubernetes >= 1.18 you should specify the ingress-controller via the field ingressClassName
# See https://kubernetes.io/blog/2020/04/02/improvements-to-the-ingress-api-in-kubernetes-1.18/#specifying-the-class-of-an-ingress
# ingressClassName: nginx
annotations: {}
labels: {}
## Final form of the hostname for each per replica ingress is
## {{ ingressPerReplica.hostPrefix }}-{{ $replicaNumber }}.{{ ingressPerReplica.hostDomain }}
##
## Prefix for the per replica ingress that will have `-$replicaNumber`
## appended to the end
hostPrefix: ""
## Domain that will be used for the per replica ingress
hostDomain: ""
## Paths to use for ingress rules
##
paths: []
# - /
## For Kubernetes >= 1.18 you should specify the pathType (determines how Ingress paths should be matched)
## See https://kubernetes.io/blog/2020/04/02/improvements-to-the-ingress-api-in-kubernetes-1.18/#better-path-matching-with-path-types
# pathType: ImplementationSpecific
## Secret name containing the TLS certificate for alertmanager per replica ingress
## Secret must be manually created in the namespace
tlsSecretName: ""
## Separated secret for each per replica Ingress. Can be used together with cert-manager
##
tlsSecretPerReplica:
enabled: false
## Final form of the secret for each per replica ingress is
## {{ tlsSecretPerReplica.prefix }}-{{ $replicaNumber }}
##
prefix: "alertmanager"
## Configuration for Alertmanager service
##
service:
annotations: {}
labels: {}
clusterIP: ""
## Port for Alertmanager Service to listen on
##
port: 9093
## To be used with a proxy extraContainer port
##
targetPort: 9093
## Port to expose on each node
## Only used if service.type is 'NodePort'
##
nodePort: 30903
## List of IP addresses at which the Prometheus server service is available
## Ref: https://kubernetes.io/docs/user-guide/services/#external-ips
##
## Additional ports to open for Alertmanager service
additionalPorts: []
externalIPs: []
loadBalancerIP: ""
loadBalancerSourceRanges: []
## Service type
##
type: ClusterIP
## Configuration for creating a separate Service for each statefulset Alertmanager replica
##
servicePerReplica:
enabled: false
annotations: {}
## Port for Alertmanager Service per replica to listen on
##
port: 9093
## To be used with a proxy extraContainer port
targetPort: 9093
## Port to expose on each node
## Only used if servicePerReplica.type is 'NodePort'
##
nodePort: 30904
## Loadbalancer source IP ranges
## Only used if servicePerReplica.type is "loadbalancer"
loadBalancerSourceRanges: []
## Service type
##
type: ClusterIP
## If true, create a serviceMonitor for alertmanager
##
serviceMonitor:
## Scrape interval. If not set, the Prometheus default scrape interval is used.
##
interval: ""
selfMonitor: true
## scheme: HTTP scheme to use for scraping. Can be used with `tlsConfig` for example if using istio mTLS.
scheme: ""
## tlsConfig: TLS configuration to use when scraping the endpoint. For example if using istio mTLS.
## Of type: https://github.com/coreos/prometheus-operator/blob/master/Documentation/api.md#tlsconfig
tlsConfig: {}
bearerTokenFile:
## metric relabel configs to apply to samples before ingestion.
##
metricRelabelings: []
# - action: keep
# regex: 'kube_(daemonset|deployment|pod|namespace|node|statefulset).+'
# sourceLabels: [__name__]
# relabel configs to apply to samples before ingestion.
##
relabelings: []
# - sourceLabels: [__meta_kubernetes_pod_node_name]
# separator: ;
# regex: ^(.*)$
# targetLabel: nodename
# replacement: $1
# action: replace
## Settings affecting alertmanagerSpec
## ref: https://github.com/prometheus-operator/prometheus-operator/blob/master/Documentation/api.md#alertmanagerspec
##
alertmanagerSpec:
## Standard object’s metadata. More info: https://github.com/kubernetes/community/blob/master/contributors/devel/sig-architecture/api-conventions.md#metadata
## Metadata Labels and Annotations gets propagated to the Alertmanager pods.
##
podMetadata: {}
## Image of Alertmanager
##
image:
repository: quay.io/prometheus/alertmanager
tag: v0.21.0
sha: ""
## If true then the user will be responsible to provide a secret with alertmanager configuration
## So when true the config part will be ignored (including templateFiles) and the one in the secret will be used
##
useExistingSecret: false
## Secrets is a list of Secrets in the same namespace as the Alertmanager object, which shall be mounted into the
## Alertmanager Pods. The Secrets are mounted into /etc/alertmanager/secrets/.
##
secrets: []
## ConfigMaps is a list of ConfigMaps in the same namespace as the Alertmanager object, which shall be mounted into the Alertmanager Pods.
## The ConfigMaps are mounted into /etc/alertmanager/configmaps/.
##
configMaps: []
## ConfigSecret is the name of a Kubernetes Secret in the same namespace as the Alertmanager object, which contains configuration for
## this Alertmanager instance. Defaults to 'alertmanager-' The secret is mounted into /etc/alertmanager/config.
##
# configSecret:
## AlertmanagerConfigs to be selected to merge and configure Alertmanager with.
##
alertmanagerConfigSelector: {}
## Example which selects all alertmanagerConfig resources
## with label "alertconfig" with values any of "example-config" or "example-config-2"
# alertmanagerConfigSelector:
# matchExpressions:
# - key: alertconfig
# operator: In
# values:
# - example-config
# - example-config-2
#
## Example which selects all alertmanagerConfig resources with label "role" set to "example-config"
# alertmanagerConfigSelector:
# matchLabels:
# role: example-config
## Namespaces to be selected for AlertmanagerConfig discovery. If nil, only check own namespace.
##
alertmanagerConfigNamespaceSelector: {}
## Example which selects all namespaces
## with label "alertmanagerconfig" with values any of "example-namespace" or "example-namespace-2"
# alertmanagerConfigNamespaceSelector:
# matchExpressions:
# - key: alertmanagerconfig
# operator: In
# values:
# - example-namespace
# - example-namespace-2
## Example which selects all namespaces with label "alertmanagerconfig" set to "enabled"
# alertmanagerConfigNamespaceSelector:
# matchLabels:
# alertmanagerconfig: enabled
## Define Log Format
# Use logfmt (default) or json logging
logFormat: logfmt
## Log level for Alertmanager to be configured with.
##
logLevel: info
## Size is the expected size of the alertmanager cluster. The controller will eventually make the size of the
## running cluster equal to the expected size.
replicas: 3
## Time duration Alertmanager shall retain data for. Default is '120h', and must match the regular expression
## [0-9]+(ms|s|m|h) (milliseconds seconds minutes hours).
##
retention: 120h
## Storage is the definition of how storage will be used by the Alertmanager instances.
## ref: https://github.com/prometheus-operator/prometheus-operator/blob/master/Documentation/user-guides/storage.md
##
storage:
volumeClaimTemplate:
spec:
storageClassName: nfs-storageclass
accessModes: ["ReadWriteMany"]
resources:
requests:
storage: 10Gi
# selector: {}
## The external URL the Alertmanager instances will be available under. This is necessary to generate correct URLs. This is necessary if Alertmanager is not served from root of a DNS name. string false
##
externalUrl:
## The route prefix Alertmanager registers HTTP handlers for. This is useful, if using ExternalURL and a proxy is rewriting HTTP routes of a request, and the actual ExternalURL is still true,
## but the server serves requests under a different route prefix. For example for use with kubectl proxy.
##
routePrefix: /
## If set to true all actions on the underlying managed objects are not going to be performed, except for delete actions.
##
paused: false
## Define which Nodes the Pods are scheduled on.
## ref: https://kubernetes.io/docs/user-guide/node-selection/
##
nodeSelector: {}
## Define resources requests and limits for single Pods.
## ref: https://kubernetes.io/docs/user-guide/compute-resources/
##
resources: {}
# requests:
# memory: 400Mi
## Pod anti-affinity can prevent the scheduler from placing Prometheus replicas on the same node.
## The default value "soft" means that the scheduler should *prefer* to not schedule two replica pods onto the same node but no guarantee is provided.
## The value "hard" means that the scheduler is *required* to not schedule two replica pods onto the same node.
## The value "" will disable pod anti-affinity so that no anti-affinity rules will be configured.
##
podAntiAffinity: ""
## If anti-affinity is enabled sets the topologyKey to use for anti-affinity.
## This can be changed to, for example, failure-domain.beta.kubernetes.io/zone
##
podAntiAffinityTopologyKey: kubernetes.io/hostname
## Assign custom affinity rules to the alertmanager instance
## ref: https://kubernetes.io/docs/concepts/configuration/assign-pod-node/
##
affinity: {}
# nodeAffinity:
# requiredDuringSchedulingIgnoredDuringExecution:
# nodeSelectorTerms:
# - matchExpressions:
# - key: kubernetes.io/e2e-az-name
# operator: In
# values:
# - e2e-az1
# - e2e-az2
## If specified, the pod's tolerations.
## ref: https://kubernetes.io/docs/concepts/configuration/taint-and-toleration/
##
tolerations: []
# - key: "key"
# operator: "Equal"
# value: "value"
# effect: "NoSchedule"
## If specified, the pod's topology spread constraints.
## ref: https://kubernetes.io/docs/concepts/workloads/pods/pod-topology-spread-constraints/
##
topologySpreadConstraints: []
# - maxSkew: 1
# topologyKey: topology.kubernetes.io/zone
# whenUnsatisfiable: DoNotSchedule
# labelSelector:
# matchLabels:
# app: alertmanager
## SecurityContext holds pod-level security attributes and common container settings.
## This defaults to non root user with uid 1000 and gid 2000. *v1.PodSecurityContext false
## ref: https://kubernetes.io/docs/tasks/configure-pod-container/security-context/
##
securityContext:
runAsGroup: 2000
runAsNonRoot: true
runAsUser: 1000
fsGroup: 2000
## ListenLocal makes the Alertmanager server listen on loopback, so that it does not bind against the Pod IP.
## Note this is only for the Alertmanager UI, not the gossip communication.
##
listenLocal: false
## Containers allows injecting additional containers. This is meant to allow adding an authentication proxy to an Alertmanager pod.
##
containers: []
# Additional volumes on the output StatefulSet definition.
volumes: []
# Additional VolumeMounts on the output StatefulSet definition.
volumeMounts: []
## InitContainers allows injecting additional initContainers. This is meant to allow doing some changes
## (permissions, dir tree) on mounted volumes before starting prometheus
initContainers: []
## Priority class assigned to the Pods
##
priorityClassName: ""
## AdditionalPeers allows injecting a set of additional Alertmanagers to peer with to form a highly available cluster.
##
additionalPeers: []
## PortName to use for Alert Manager.
##
portName: "web"
## ClusterAdvertiseAddress is the explicit address to advertise in cluster. Needs to be provided for non RFC1918 [1] (public) addresses. [1] RFC1918: https://tools.ietf.org/html/rfc1918
##
clusterAdvertiseAddress: false
## ForceEnableClusterMode ensures Alertmanager does not deactivate the cluster mode when running with a single replica.
## Use case is e.g. spanning an Alertmanager cluster across Kubernetes clusters with a single replica in each.
forceEnableClusterMode: false
## Using default values from https://github.com/grafana/helm-charts/blob/main/charts/grafana/values.yaml
##
grafana:
enabled: true
namespaceOverride: "monitoring"
## Deploy default dashboards.
##
defaultDashboardsEnabled: true
adminPassword: prom-operator
ingress:
## If true, Grafana Ingress will be created
##
enabled: true
## Annotations for Grafana Ingress
##
annotations: {}
# kubernetes.io/ingress.class: nginx
# kubernetes.io/tls-acme: "true"
## Labels to be added to the Ingress
##
labels: {}
## Hostnames.
## Must be provided if Ingress is enable.
##
hosts:
- grafana.prod.test.local
#hosts: []
## Path for grafana ingress
path: /
## TLS configuration for grafana Ingress
## Secret must be manually created in the namespace
##
tls: []
# - secretName: grafana-general-tls
# hosts:
# - grafana.example.com
sidecar:
dashboards:
enabled: true
label: grafana_dashboard
## Annotations for Grafana dashboard configmaps
##
annotations: {}
multicluster: false
datasources:
enabled: true
defaultDatasourceEnabled: true
# If not defined, will use prometheus.prometheusSpec.scrapeInterval or its default
# defaultDatasourceScrapeInterval: 15s
## Annotations for Grafana datasource configmaps
##
annotations: {}
## Create datasource for each Pod of Prometheus StatefulSet;
## this uses headless service `prometheus-operated` which is
## created by Prometheus Operator
## ref: https://git.io/fjaBS
createPrometheusReplicasDatasources: false
label: grafana_datasource
extraConfigmapMounts: []
# - name: certs-configmap
# mountPath: /etc/grafana/ssl/
# configMap: certs-configmap
# readOnly: true
## Configure additional grafana datasources (passed through tpl)
## ref: http://docs.grafana.org/administration/provisioning/#datasources
additionalDataSources: []
# - name: prometheus-sample
# access: proxy
# basicAuth: true
# basicAuthPassword: pass
# basicAuthUser: daco
# editable: false
# jsonData:
# tlsSkipVerify: true
# orgId: 1
# type: prometheus
# url: https://{{ printf "%s-prometheus.svc" .Release.Name }}:9090
# version: 1
## Passed to grafana subchart and used by servicemonitor below
##
service:
portName: service
## If true, create a serviceMonitor for grafana
##
serviceMonitor:
## Scrape interval. If not set, the Prometheus default scrape interval is used.
##
interval: ""
selfMonitor: true
# Path to use for scraping metrics. Might be different if server.root_url is set
# in grafana.ini
path: "/metrics"
## metric relabel configs to apply to samples before ingestion.
##
metricRelabelings: []
# - action: keep
# regex: 'kube_(daemonset|deployment|pod|namespace|node|statefulset).+'
# sourceLabels: [__name__]
# relabel configs to apply to samples before ingestion.
##
relabelings: []
# - sourceLabels: [__meta_kubernetes_pod_node_name]
# separator: ;
# regex: ^(.*)$
# targetLabel: nodename
# replacement: $1
# action: replace
## Component scraping the kube api server
##
kubeApiServer:
enabled: true
tlsConfig:
serverName: kubernetes
insecureSkipVerify: false
## If your API endpoint address is not reachable (as in AKS) you can replace it with the kubernetes service
##
relabelings: []
# - sourceLabels:
# - __meta_kubernetes_namespace
# - __meta_kubernetes_service_name
# - __meta_kubernetes_endpoint_port_name
# action: keep
# regex: default;kubernetes;https
# - targetLabel: __address__
# replacement: kubernetes.default.svc:443
serviceMonitor:
## Scrape interval. If not set, the Prometheus default scrape interval is used.
##
interval: ""
jobLabel: component
selector:
matchLabels:
component: apiserver
provider: kubernetes
## metric relabel configs to apply to samples before ingestion.
##
metricRelabelings: []
# - action: keep
# regex: 'kube_(daemonset|deployment|pod|namespace|node|statefulset).+'
# sourceLabels: [__name__]
## Component scraping the kubelet and kubelet-hosted cAdvisor
##
kubelet:
enabled: true
namespace: kube-system
serviceMonitor:
## Scrape interval. If not set, the Prometheus default scrape interval is used.
##
interval: ""
## Enable scraping the kubelet over https. For requirements to enable this see
## https://github.com/prometheus-operator/prometheus-operator/issues/926
##
https: true
## Enable scraping /metrics/cadvisor from kubelet's service
##
cAdvisor: true
## Enable scraping /metrics/probes from kubelet's service
##
probes: true
## Enable scraping /metrics/resource from kubelet's service
## This is disabled by default because container metrics are already exposed by cAdvisor
##
resource: true
# From kubernetes 1.18, /metrics/resource/v1alpha1 renamed to /metrics/resource
resourcePath: "/metrics/resource/v1alpha1"
## Metric relabellings to apply to samples before ingestion
##
cAdvisorMetricRelabelings: []
# - sourceLabels: [__name__, image]
# separator: ;
# regex: container_([a-z_]+);
# replacement: $1
# action: drop
# - sourceLabels: [__name__]
# separator: ;
# regex: container_(network_tcp_usage_total|network_udp_usage_total|tasks_state|cpu_load_average_10s)
# replacement: $1
# action: drop
## Metric relabellings to apply to samples before ingestion
##
probesMetricRelabelings: []
# - sourceLabels: [__name__, image]
# separator: ;
# regex: container_([a-z_]+);
# replacement: $1
# action: drop
# - sourceLabels: [__name__]
# separator: ;
# regex: container_(network_tcp_usage_total|network_udp_usage_total|tasks_state|cpu_load_average_10s)
# replacement: $1
# action: drop
# relabel configs to apply to samples before ingestion.
# metrics_path is required to match upstream rules and charts
##
cAdvisorRelabelings:
- sourceLabels: [__metrics_path__]
targetLabel: metrics_path
# - sourceLabels: [__meta_kubernetes_pod_node_name]
# separator: ;
# regex: ^(.*)$
# targetLabel: nodename
# replacement: $1
# action: replace
probesRelabelings:
- sourceLabels: [__metrics_path__]
targetLabel: metrics_path
# - sourceLabels: [__meta_kubernetes_pod_node_name]
# separator: ;
# regex: ^(.*)$
# targetLabel: nodename
# replacement: $1
# action: replace
resourceRelabelings:
- sourceLabels: [__metrics_path__]
targetLabel: metrics_path
# - sourceLabels: [__meta_kubernetes_pod_node_name]
# separator: ;
# regex: ^(.*)$
# targetLabel: nodename
# replacement: $1
# action: replace
metricRelabelings: []
# - sourceLabels: [__name__, image]
# separator: ;
# regex: container_([a-z_]+);
# replacement: $1
# action: drop
# - sourceLabels: [__name__]
# separator: ;
# regex: container_(network_tcp_usage_total|network_udp_usage_total|tasks_state|cpu_load_average_10s)
# replacement: $1
# action: drop
# relabel configs to apply to samples before ingestion.
# metrics_path is required to match upstream rules and charts
##
relabelings:
- sourceLabels: [__metrics_path__]
targetLabel: metrics_path
# - sourceLabels: [__meta_kubernetes_pod_node_name]
# separator: ;
# regex: ^(.*)$
# targetLabel: nodename
# replacement: $1
# action: replace
## Component scraping the kube controller manager
##
kubeControllerManager:
enabled: true
## If your kube controller manager is not deployed as a pod, specify IPs it can be found on
##
endpoints: []
# - 10.141.4.22
# - 10.141.4.23
# - 10.141.4.24
## If using kubeControllerManager.endpoints only the port and targetPort are used
##
service:
port: 10252
targetPort: 10252
selector:
k8s-app: kube-controller-manager
# component: kube-controller-manager
serviceMonitor:
## Scrape interval. If not set, the Prometheus default scrape interval is used.
##
interval: ""
## Enable scraping kube-controller-manager over https.
## Requires proper certs (not self-signed) and delegated authentication/authorization checks
##
https: false
# Skip TLS certificate validation when scraping
insecureSkipVerify: null
# Name of the server to use when validating TLS certificate
serverName: null
## metric relabel configs to apply to samples before ingestion.
##
metricRelabelings: []
# - action: keep
# regex: 'kube_(daemonset|deployment|pod|namespace|node|statefulset).+'
# sourceLabels: [__name__]
# relabel configs to apply to samples before ingestion.
##
relabelings: []
# - sourceLabels: [__meta_kubernetes_pod_node_name]
# separator: ;
# regex: ^(.*)$
# targetLabel: nodename
# replacement: $1
# action: replace
## Component scraping coreDns. Use either this or kubeDns
##
coreDns:
enabled: true
service:
port: 9153
targetPort: 9153
# selector:
# k8s-app: kube-dns
serviceMonitor:
## Scrape interval. If not set, the Prometheus default scrape interval is used.
##
interval: ""
## metric relabel configs to apply to samples before ingestion.
##
metricRelabelings: []
# - action: keep
# regex: 'kube_(daemonset|deployment|pod|namespace|node|statefulset).+'
# sourceLabels: [__name__]
# relabel configs to apply to samples before ingestion.
##
relabelings: []
# - sourceLabels: [__meta_kubernetes_pod_node_name]
# separator: ;
# regex: ^(.*)$
# targetLabel: nodename
# replacement: $1
# action: replace
## Component scraping kubeDns. Use either this or coreDns
##
kubeDns:
enabled: false
service:
dnsmasq:
port: 10054
targetPort: 10054
skydns:
port: 10055
targetPort: 10055
# selector:
# k8s-app: kube-dns
serviceMonitor:
## Scrape interval. If not set, the Prometheus default scrape interval is used.
##
interval: ""
## metric relabel configs to apply to samples before ingestion.
##
metricRelabelings: []
# - action: keep
# regex: 'kube_(daemonset|deployment|pod|namespace|node|statefulset).+'
# sourceLabels: [__name__]
# relabel configs to apply to samples before ingestion.
##
relabelings: []
# - sourceLabels: [__meta_kubernetes_pod_node_name]
# separator: ;
# regex: ^(.*)$
# targetLabel: nodename
# replacement: $1
# action: replace
dnsmasqMetricRelabelings: []
# - action: keep
# regex: 'kube_(daemonset|deployment|pod|namespace|node|statefulset).+'
# sourceLabels: [__name__]
# relabel configs to apply to samples before ingestion.
##
dnsmasqRelabelings: []
# - sourceLabels: [__meta_kubernetes_pod_node_name]
# separator: ;
# regex: ^(.*)$
# targetLabel: nodename
# replacement: $1
# action: replace
## Component scraping etcd
##
kubeEtcd:
enabled: true
## If your etcd is not deployed as a pod, specify IPs it can be found on
##
endpoints: []
# - 10.141.4.22
# - 10.141.4.23
# - 10.141.4.24
## Etcd service. If using kubeEtcd.endpoints only the port and targetPort are used
##
service:
port: 2379
targetPort: 2379
# selector:
# component: etcd
## Configure secure access to the etcd cluster by loading a secret into prometheus and
## specifying security configuration below. For example, with a secret named etcd-client-cert
##
## serviceMonitor:
## scheme: https
## insecureSkipVerify: false
## serverName: localhost
## caFile: /etc/prometheus/secrets/etcd-client-cert/etcd-ca
## certFile: /etc/prometheus/secrets/etcd-client-cert/etcd-client
## keyFile: /etc/prometheus/secrets/etcd-client-cert/etcd-client-key
##
serviceMonitor:
## Scrape interval. If not set, the Prometheus default scrape interval is used.
##
interval: ""
scheme: http
insecureSkipVerify: false
serverName: ""
caFile: ""
certFile: ""
keyFile: ""
## metric relabel configs to apply to samples before ingestion.
##
metricRelabelings: []
# - action: keep
# regex: 'kube_(daemonset|deployment|pod|namespace|node|statefulset).+'
# sourceLabels: [__name__]
# relabel configs to apply to samples before ingestion.
##
relabelings: []
# - sourceLabels: [__meta_kubernetes_pod_node_name]
# separator: ;
# regex: ^(.*)$
# targetLabel: nodename
# replacement: $1
# action: replace
## Component scraping kube scheduler
##
kubeScheduler:
enabled: true
## If your kube scheduler is not deployed as a pod, specify IPs it can be found on
##
endpoints: []
# - 10.141.4.22
# - 10.141.4.23
# - 10.141.4.24
## If using kubeScheduler.endpoints only the port and targetPort are used
##
service:
port: 10251
targetPort: 10251
selector:
k8s-app: kube-scheduler
# component: kube-scheduler
serviceMonitor:
## Scrape interval. If not set, the Prometheus default scrape interval is used.
##
interval: ""
## Enable scraping kube-scheduler over https.
## Requires proper certs (not self-signed) and delegated authentication/authorization checks
##
https: false
## Skip TLS certificate validation when scraping
insecureSkipVerify: null
## Name of the server to use when validating TLS certificate
serverName: null
## metric relabel configs to apply to samples before ingestion.
##
metricRelabelings: []
# - action: keep
# regex: 'kube_(daemonset|deployment|pod|namespace|node|statefulset).+'
# sourceLabels: [__name__]
# relabel configs to apply to samples before ingestion.
##
relabelings: []
# - sourceLabels: [__meta_kubernetes_pod_node_name]
# separator: ;
# regex: ^(.*)$
# targetLabel: nodename
# replacement: $1
# action: replace
## Component scraping kube proxy
##
kubeProxy:
enabled: true
## If your kube proxy is not deployed as a pod, specify IPs it can be found on
##
endpoints: []
# - 10.141.4.22
# - 10.141.4.23
# - 10.141.4.24
service:
port: 10249
targetPort: 10249
# selector:
# k8s-app: kube-proxy
serviceMonitor:
## Scrape interval. If not set, the Prometheus default scrape interval is used.
##
interval: ""
## Enable scraping kube-proxy over https.
## Requires proper certs (not self-signed) and delegated authentication/authorization checks
##
https: false
## metric relabel configs to apply to samples before ingestion.
##
metricRelabelings: []
# - action: keep
# regex: 'kube_(daemonset|deployment|pod|namespace|node|statefulset).+'
# sourceLabels: [__name__]
# relabel configs to apply to samples before ingestion.
##
relabelings: []
# - action: keep
# regex: 'kube_(daemonset|deployment|pod|namespace|node|statefulset).+'
# sourceLabels: [__name__]
## Component scraping kube state metrics
##
kubeStateMetrics:
enabled: true
serviceMonitor:
## Scrape interval. If not set, the Prometheus default scrape interval is used.
##
interval: ""
## Override serviceMonitor selector
##
selectorOverride: {}
## metric relabel configs to apply to samples before ingestion.
##
metricRelabelings: []
# - action: keep
# regex: 'kube_(daemonset|deployment|pod|namespace|node|statefulset).+'
# sourceLabels: [__name__]
# relabel configs to apply to samples before ingestion.
##
relabelings: []
# - sourceLabels: [__meta_kubernetes_pod_node_name]
# separator: ;
# regex: ^(.*)$
# targetLabel: nodename
# replacement: $1
# action: replace
## Configuration for kube-state-metrics subchart

##

kube-state-metrics:

  namespaceOverride: "monitoring"

  rbac:

    create: true

  podSecurityPolicy:

    enabled: true
## Deploy node exporter as a daemonset to all nodes
##
nodeExporter:
enabled: true
## Use the value configured in prometheus-node-exporter.podLabels
##
jobLabel: jobLabel
serviceMonitor:
## Scrape interval. If not set, the Prometheus default scrape interval is used.
##
interval: ""
## How long until a scrape request times out. If not set, the Prometheus default scape timeout is used.
##
scrapeTimeout: ""
## metric relabel configs to apply to samples before ingestion.
##
metricRelabelings: []
# - sourceLabels: [__name__]
# separator: ;
# regex: ^node_mountstats_nfs_(event|operations|transport)_.+
# replacement: $1
# action: drop
## relabel configs to apply to samples before ingestion.
##
relabelings: []
# - sourceLabels: [__meta_kubernetes_pod_node_name]
# separator: ;
# regex: ^(.*)$
# targetLabel: nodename
# replacement: $1
# action: replace
## Configuration for prometheus-node-exporter subchart

##

prometheus-node-exporter:

  namespaceOverride: "monitoring"
podLabels:
## Add the 'node-exporter' label to be used by serviceMonitor to match standard common usage in rules and grafana dashboards
##
jobLabel: node-exporter
extraArgs:
- --collector.filesystem.ignored-mount-points=^/(dev|proc|sys|var/lib/docker/.+|var/lib/kubelet/.+)($|/)
- --collector.filesystem.ignored-fs-types=^(autofs|binfmt_misc|bpf|cgroup2?|configfs|debugfs|devpts|devtmpfs|fusectl|hugetlbfs|iso9660|mqueue|nsfs|overlay|proc|procfs|pstore|rpc_pipefs|securityfs|selinuxfs|squashfs|sysfs|tracefs)$
## Manages Prometheus and Alertmanager components
##
prometheusOperator:
enabled: true
## Prometheus-Operator v0.39.0 and later support TLS natively.
##
tls:
enabled: true
# Value must match version names from https://golang.org/pkg/crypto/tls/#pkg-constants
tlsMinVersion: VersionTLS13
# The default webhook port is 10250 in order to work out-of-the-box in GKE private clusters and avoid adding firewall rules.
internalPort: 10250
## Admission webhook support for PrometheusRules resources added in Prometheus Operator 0.30 can be enabled to prevent incorrectly formatted
## rules from making their way into prometheus and potentially preventing the container from starting
admissionWebhooks:
failurePolicy: Fail
enabled: true
## A PEM encoded CA bundle which will be used to validate the webhook's server certificate.
## If unspecified, system trust roots on the apiserver are used.
caBundle: ""
## If enabled, generate a self-signed certificate, then patch the webhook configurations with the generated data.
## On chart upgrades (or if the secret exists) the cert will not be re-generated. You can use this to provide your own
## certs ahead of time if you wish.
##
patch:
enabled: true
image:
repository: jettech/kube-webhook-certgen
tag: v1.5.0
sha: ""
pullPolicy: IfNotPresent
resources: {}
## Provide a priority class name to the webhook patching job
##
priorityClassName: ""
podAnnotations: {}
nodeSelector: {}
affinity: {}
tolerations: []
# Use certmanager to generate webhook certs
certManager:
enabled: false
# issuerRef:
# name: "issuer"
# kind: "ClusterIssuer"
## Namespaces to scope the interaction of the Prometheus Operator and the apiserver (allow list).
## This is mutually exclusive with denyNamespaces. Setting this to an empty object will disable the configuration
##
namespaces: {}
# releaseNamespace: true
# additional:
# - kube-system
## Namespaces not to scope the interaction of the Prometheus Operator (deny list).
##
denyNamespaces: []
## Filter namespaces to look for prometheus-operator custom resources
##
alertmanagerInstanceNamespaces: []
prometheusInstanceNamespaces: []
thanosRulerInstanceNamespaces: []
## The clusterDomain value will be added to the cluster.peer option of the alertmanager.
## Without this specified option cluster.peer will have value alertmanager-monitoring-alertmanager-0.alertmanager-operated:9094 (default value)
## With this specified option cluster.peer will have value alertmanager-monitoring-alertmanager-0.alertmanager-operated.namespace.svc.cluster-domain:9094
##
# clusterDomain: "cluster.local"
## Service account for Alertmanager to use.
## ref: https://kubernetes.io/docs/tasks/configure-pod-container/configure-service-account/
##
serviceAccount:
create: true
name: ""
## Configuration for Prometheus operator service
##
service:
annotations: {}
labels: {}
clusterIP: ""
## Port to expose on each node
## Only used if service.type is 'NodePort'
##
nodePort: 30080
nodePortTls: 30443
## Additional ports to open for Prometheus service
## ref: https://kubernetes.io/docs/concepts/services-networking/service/#multi-port-services
##
additionalPorts: []
## Loadbalancer IP
## Only use if service.type is "loadbalancer"
##
loadBalancerIP: ""
loadBalancerSourceRanges: []
## Service type
## NodePort, ClusterIP, loadbalancer
##
type: ClusterIP
## List of IP addresses at which the Prometheus server service is available
## Ref: https://kubernetes.io/docs/user-guide/services/#external-ips
##
externalIPs: []
## Labels to add to the operator pod
##
podLabels: {}
## Annotations to add to the operator pod
##
podAnnotations: {}
## Assign a PriorityClassName to pods if set
# priorityClassName: ""
## Define Log Format
# Use logfmt (default) or json logging
# logFormat: logfmt
## Decrease log verbosity to errors only
# logLevel: error
## If true, the operator will create and maintain a service for scraping kubelets
## ref: https://github.com/prometheus-operator/prometheus-operator/blob/master/helm/prometheus-operator/README.md
##
kubeletService:
enabled: true
namespace: kube-system
## Create a servicemonitor for the operator
##
serviceMonitor:
## Scrape interval. If not set, the Prometheus default scrape interval is used.
##
interval: ""
## Scrape timeout. If not set, the Prometheus default scrape timeout is used.
scrapeTimeout: ""
selfMonitor: true
## metric relabel configs to apply to samples before ingestion.
##
metricRelabelings: []
# - action: keep
# regex: 'kube_(daemonset|deployment|pod|namespace|node|statefulset).+'
# sourceLabels: [__name__]
# relabel configs to apply to samples before ingestion.
##
relabelings: []
# - sourceLabels: [__meta_kubernetes_pod_node_name]
# separator: ;
# regex: ^(.*)$
# targetLabel: nodename
# replacement: $1
# action: replace
## Resource limits & requests
##
resources: {}
# limits:
# cpu: 200m
# memory: 200Mi
# requests:
# cpu: 100m
# memory: 100Mi
# Required for use in managed kubernetes clusters (such as AWS EKS) with custom CNI (such as calico),
# because control-plane managed by AWS cannot communicate with pods' IP CIDR and admission webhooks are not working
##
hostNetwork: false
## Define which Nodes the Pods are scheduled on.
## ref: https://kubernetes.io/docs/user-guide/node-selection/
##
nodeSelector: {}
## Tolerations for use with node taints
## ref: https://kubernetes.io/docs/concepts/configuration/taint-and-toleration/
##
tolerations: []
# - key: "key"
# operator: "Equal"
# value: "value"
# effect: "NoSchedule"
## Assign custom affinity rules to the prometheus operator
## ref: https://kubernetes.io/docs/concepts/configuration/assign-pod-node/
##
affinity: {}
# nodeAffinity:
# requiredDuringSchedulingIgnoredDuringExecution:
# nodeSelectorTerms:
# - matchExpressions:
# - key: kubernetes.io/e2e-az-name
# operator: In
# values:
# - e2e-az1
# - e2e-az2
dnsConfig: {}
# nameservers:
# - 1.2.3.4
# searches:
# - ns1.svc.cluster-domain.example
# - my.dns.search.suffix
# options:
# - name: ndots
# value: "2"
# - name: edns0
securityContext:
fsGroup: 65534
runAsGroup: 65534
runAsNonRoot: true
runAsUser: 65534
## Prometheus-operator image
##
image:
repository: quay.io/prometheus-operator/prometheus-operator
tag: v0.45.0
sha: ""
pullPolicy: IfNotPresent
## Prometheus image to use for prometheuses managed by the operator
##
# prometheusDefaultBaseImage: quay.io/prometheus/prometheus
## Alertmanager image to use for alertmanagers managed by the operator
##
# alertmanagerDefaultBaseImage: quay.io/prometheus/alertmanager
## Prometheus-config-reloader image to use for config and rule reloading
##
prometheusConfigReloaderImage:
repository: quay.io/prometheus-operator/prometheus-config-reloader
tag: v0.45.0
sha: ""
## Set the prometheus config reloader side-car CPU limit
##
configReloaderCpu: 100m
## Set the prometheus config reloader side-car memory limit
##
configReloaderMemory: 50Mi
## Set a Field Selector to filter watched secrets
##
secretFieldSelector: ""
## Deploy a Prometheus instance
##
prometheus:
enabled: true
## Annotations for Prometheus
##
annotations: {}
## Service account for Prometheuses to use.
## ref: https://kubernetes.io/docs/tasks/configure-pod-container/configure-service-account/
##
serviceAccount:
create: true
name: ""
# Service for thanos service discovery on sidecar
# Enable this can make Thanos Query can use
# `--store=dnssrv+_grpc._tcp.${kube-prometheus-stack.fullname}-thanos-discovery.${namespace}.svc.cluster.local` to discovery
# Thanos sidecar on prometheus nodes
# (Please remember to change ${kube-prometheus-stack.fullname} and ${namespace}. Not just copy and paste!)
thanosService:
enabled: false
annotations: {}
labels: {}
portName: grpc
port: 10901
targetPort: "grpc"
## Configuration for Prometheus service
##
service:
annotations: {}
labels: {}
clusterIP: ""
## Port for Prometheus Service to listen on
##
port: 9090
## To be used with a proxy extraContainer port
targetPort: 9090
## List of IP addresses at which the Prometheus server service is available
## Ref: https://kubernetes.io/docs/user-guide/services/#external-ips
##
externalIPs: []
## Port to expose on each node
## Only used if service.type is 'NodePort'
##
nodePort: 30090
## Loadbalancer IP
## Only use if service.type is "loadbalancer"
loadBalancerIP: ""
loadBalancerSourceRanges: []
## Service type
##
type: ClusterIP
sessionAffinity: ""
## Configuration for creating a separate Service for each statefulset Prometheus replica
##
servicePerReplica:
enabled: false
annotations: {}
## Port for Prometheus Service per replica to listen on
##
port: 9090
## To be used with a proxy extraContainer port
targetPort: 9090
## Port to expose on each node
## Only used if servicePerReplica.type is 'NodePort'
##
nodePort: 30091
## Loadbalancer source IP ranges
## Only used if servicePerReplica.type is "loadbalancer"
loadBalancerSourceRanges: []
## Service type
##
type: ClusterIP
## Configure pod disruption budgets for Prometheus
## ref: https://kubernetes.io/docs/tasks/run-application/configure-pdb/#specifying-a-poddisruptionbudget
## This configuration is immutable once created and will require the PDB to be deleted to be changed
## https://github.com/kubernetes/kubernetes/issues/45398
##
podDisruptionBudget:
enabled: false
minAvailable: 1
maxUnavailable: ""
# Ingress exposes thanos sidecar outside the cluster
thanosIngress:
enabled: false
# For Kubernetes >= 1.18 you should specify the ingress-controller via the field ingressClassName
# See https://kubernetes.io/blog/2020/04/02/improvements-to-the-ingress-api-in-kubernetes-1.18/#specifying-the-class-of-an-ingress
# ingressClassName: nginx
annotations: {}
labels: {}
servicePort: 10901
## Port to expose on each node
## Only used if service.type is 'NodePort'
##
nodePort: 30901
## Hosts must be provided if Ingress is enabled.
##
hosts: []
# - thanos-gateway.domain.com
## Paths to use for ingress rules
##
paths: []
# - /
## For Kubernetes >= 1.18 you should specify the pathType (determines how Ingress paths should be matched)
## See https://kubernetes.io/blog/2020/04/02/improvements-to-the-ingress-api-in-kubernetes-1.18/#better-path-matching-with-path-types
# pathType: ImplementationSpecific
## TLS configuration for Thanos Ingress
## Secret must be manually created in the namespace
##
tls: []
# - secretName: thanos-gateway-tls
# hosts:
# - thanos-gateway.domain.com
ingress:
enabled: true
# For Kubernetes >= 1.18 you should specify the ingress-controller via the field ingressClassName
# See https://kubernetes.io/blog/2020/04/02/improvements-to-the-ingress-api-in-kubernetes-1.18/#specifying-the-class-of-an-ingress
# ingressClassName: nginx
annotations: {}
labels: {}
## Hostnames.
## Must be provided if Ingress is enabled.
##
hosts:
- prometheus.prod.test.local
#hosts: []
## Paths to use for ingress rules - one path should match the prometheusSpec.routePrefix
##
paths:
- /
## For Kubernetes >= 1.18 you should specify the pathType (determines how Ingress paths should be matched)
## See https://kubernetes.io/blog/2020/04/02/improvements-to-the-ingress-api-in-kubernetes-1.18/#better-path-matching-with-path-types
# pathType: ImplementationSpecific
## TLS configuration for Prometheus Ingress
## Secret must be manually created in the namespace
##
tls: []
# - secretName: prometheus-general-tls
# hosts:
# - prometheus.example.com
## Configuration for creating an Ingress that will map to each Prometheus replica service
## prometheus.servicePerReplica must be enabled
##
ingressPerReplica:
enabled: false
# For Kubernetes >= 1.18 you should specify the ingress-controller via the field ingressClassName
# See https://kubernetes.io/blog/2020/04/02/improvements-to-the-ingress-api-in-kubernetes-1.18/#specifying-the-class-of-an-ingress
# ingressClassName: nginx
annotations: {}
labels: {}
## Final form of the hostname for each per replica ingress is
## {{ ingressPerReplica.hostPrefix }}-{{ $replicaNumber }}.{{ ingressPerReplica.hostDomain }}
##
## Prefix for the per replica ingress that will have `-$replicaNumber`
## appended to the end
hostPrefix: ""
## Domain that will be used for the per replica ingress
hostDomain: ""
## Paths to use for ingress rules
##
paths: []
# - /
## For Kubernetes >= 1.18 you should specify the pathType (determines how Ingress paths should be matched)
## See https://kubernetes.io/blog/2020/04/02/improvements-to-the-ingress-api-in-kubernetes-1.18/#better-path-matching-with-path-types
# pathType: ImplementationSpecific
## Secret name containing the TLS certificate for Prometheus per replica ingress
## Secret must be manually created in the namespace
tlsSecretName: ""
## Separated secret for each per replica Ingress. Can be used together with cert-manager
##
tlsSecretPerReplica:
enabled: false
## Final form of the secret for each per replica ingress is
## {{ tlsSecretPerReplica.prefix }}-{{ $replicaNumber }}
##
prefix: "prometheus"
## Configure additional options for default pod security policy for Prometheus
## ref: https://kubernetes.io/docs/concepts/policy/pod-security-policy/
podSecurityPolicy:
allowedCapabilities: []
allowedHostPaths: []
volumes: []
serviceMonitor:
## Scrape interval. If not set, the Prometheus default scrape interval is used.
##
interval: ""
selfMonitor: true
## scheme: HTTP scheme to use for scraping. Can be used with `tlsConfig` for example if using istio mTLS.
scheme: ""
## tlsConfig: TLS configuration to use when scraping the endpoint. For example if using istio mTLS.
## Of type: https://github.com/prometheus-operator/prometheus-operator/blob/master/Documentation/api.md#tlsconfig
tlsConfig: {}
bearerTokenFile:
## metric relabel configs to apply to samples before ingestion.
##
metricRelabelings: []
# - action: keep
# regex: 'kube_(daemonset|deployment|pod|namespace|node|statefulset).+'
# sourceLabels: [__name__]
# relabel configs to apply to samples before ingestion.
##
relabelings: []
# - sourceLabels: [__meta_kubernetes_pod_node_name]
# separator: ;
# regex: ^(.*)$
# targetLabel: nodename
# replacement: $1
# action: replace
## Settings affecting prometheusSpec
## ref: https://github.com/prometheus-operator/prometheus-operator/blob/master/Documentation/api.md#prometheusspec
##
prometheusSpec:
## If true, pass --storage.tsdb.max-block-duration=2h to prometheus. This is already done if using Thanos
##
disableCompaction: false
## APIServerConfig
## ref: https://github.com/prometheus-operator/prometheus-operator/blob/master/Documentation/api.md#apiserverconfig
##
apiserverConfig: {}
## Interval between consecutive scrapes.
## Defaults to 30s.
## ref: https://github.com/prometheus-operator/prometheus-operator/blob/release-0.44/pkg/prometheus/promcfg.go#L180-L183
##
scrapeInterval: ""
## Number of seconds to wait for target to respond before erroring
##
scrapeTimeout: ""
## Interval between consecutive evaluations.
##
evaluationInterval: ""
## ListenLocal makes the Prometheus server listen on loopback, so that it does not bind against the Pod IP.
##
listenLocal: false
## EnableAdminAPI enables Prometheus the administrative HTTP API which includes functionality such as deleting time series.
## This is disabled by default.
## ref: https://prometheus.io/docs/prometheus/latest/querying/api/#tsdb-admin-apis
##
enableAdminAPI: false
## Image of Prometheus.
##
image:
repository: quay.io/prometheus/prometheus
tag: v2.24.0
sha: ""
## Tolerations for use with node taints
## ref: https://kubernetes.io/docs/concepts/configuration/taint-and-toleration/
##
tolerations: []
# - key: "key"
# operator: "Equal"
# value: "value"
# effect: "NoSchedule"
## If specified, the pod's topology spread constraints.
## ref: https://kubernetes.io/docs/concepts/workloads/pods/pod-topology-spread-constraints/
##
topologySpreadConstraints: []
# - maxSkew: 1
# topologyKey: topology.kubernetes.io/zone
# whenUnsatisfiable: DoNotSchedule
# labelSelector:
# matchLabels:
# app: prometheus
## Alertmanagers to which alerts will be sent
## ref: https://github.com/prometheus-operator/prometheus-operator/blob/master/Documentation/api.md#alertmanagerendpoints
##
## Default configuration will connect to the alertmanager deployed as part of this release
##
alertingEndpoints: []
# - name: ""
# namespace: ""
# port: http
# scheme: http
# pathPrefix: ""
# tlsConfig: {}
# bearerTokenFile: ""
# apiVersion: v2
## External labels to add to any time series or alerts when communicating with external systems
##
externalLabels: {}
## Name of the external label used to denote replica name
##
replicaExternalLabelName: ""
## If true, the Operator won't add the external label used to denote replica name
##
replicaExternalLabelNameClear: false
## Name of the external label used to denote Prometheus instance name
##
prometheusExternalLabelName: ""
## If true, the Operator won't add the external label used to denote Prometheus instance name
##
prometheusExternalLabelNameClear: false
## External URL at which Prometheus will be reachable.
##
externalUrl: ""
## Define which Nodes the Pods are scheduled on.
## ref: https://kubernetes.io/docs/user-guide/node-selection/
##
nodeSelector: {}
## Secrets is a list of Secrets in the same namespace as the Prometheus object, which shall be mounted into the Prometheus Pods.
## The Secrets are mounted into /etc/prometheus/secrets/. Secrets changes after initial creation of a Prometheus object are not
## reflected in the running Pods. To change the secrets mounted into the Prometheus Pods, the object must be deleted and recreated
## with the new list of secrets.
##
secrets: []
## ConfigMaps is a list of ConfigMaps in the same namespace as the Prometheus object, which shall be mounted into the Prometheus Pods.
## The ConfigMaps are mounted into /etc/prometheus/configmaps/.
##
configMaps: []
## QuerySpec defines the query command line flags when starting Prometheus.
## ref: https://github.com/prometheus-operator/prometheus-operator/blob/master/Documentation/api.md#queryspec
##
query: {}
## Namespaces to be selected for PrometheusRules discovery.
## If nil, select own namespace. Namespaces to be selected for ServiceMonitor discovery.
## See https://github.com/prometheus-operator/prometheus-operator/blob/master/Documentation/api.md#namespaceselector for usage
##
ruleNamespaceSelector: {}
## If true, a nil or {} value for prometheus.prometheusSpec.ruleSelector will cause the
## prometheus resource to be created with selectors based on values in the helm deployment,
## which will also match the PrometheusRule resources created
##
ruleSelectorNilUsesHelmValues: true
## PrometheusRules to be selected for target discovery.
## If {}, select all ServiceMonitors
##
ruleSelector: {}
## Example which select all prometheusrules resources
## with label "prometheus" with values any of "example-rules" or "example-rules-2"
# ruleSelector:
# matchExpressions:
# - key: prometheus
# operator: In
# values:
# - example-rules
# - example-rules-2
#
## Example which select all prometheusrules resources with label "role" set to "example-rules"
# ruleSelector:
# matchLabels:
# role: example-rules
## If true, a nil or {} value for prometheus.prometheusSpec.serviceMonitorSelector will cause the
## prometheus resource to be created with selectors based on values in the helm deployment,
## which will also match the servicemonitors created
##
serviceMonitorSelectorNilUsesHelmValues: true
## ServiceMonitors to be selected for target discovery.
## If {}, select all ServiceMonitors
##
serviceMonitorSelector: {}
## Example which selects ServiceMonitors with label "prometheus" set to "somelabel"
# serviceMonitorSelector:
# matchLabels:
# prometheus: somelabel
    ## Namespaces to be selected for ServiceMonitor discovery.

    ##

    serviceMonitorNamespaceSelector:

       matchLabels:

         prometheus: enabled
## Example which selects ServiceMonitors in namespaces with label "prometheus" set to "somelabel"
# serviceMonitorNamespaceSelector:
# matchLabels:
# prometheus: somelabel
## If true, a nil or {} value for prometheus.prometheusSpec.podMonitorSelector will cause the
## prometheus resource to be created with selectors based on values in the helm deployment,
## which will also match the podmonitors created
##
podMonitorSelectorNilUsesHelmValues: true
## PodMonitors to be selected for target discovery.
## If {}, select all PodMonitors
##
podMonitorSelector: {}
## Example which selects PodMonitors with label "prometheus" set to "somelabel"
# podMonitorSelector:
# matchLabels:
# prometheus: somelabel
## Namespaces to be selected for PodMonitor discovery.
## See https://github.com/prometheus-operator/prometheus-operator/blob/master/Documentation/api.md#namespaceselector for usage
##
podMonitorNamespaceSelector: {}
## If true, a nil or {} value for prometheus.prometheusSpec.probeSelector will cause the
## prometheus resource to be created with selectors based on values in the helm deployment,
## which will also match the probes created
##
probeSelectorNilUsesHelmValues: true
## Probes to be selected for target discovery.
## If {}, select all Probes
##
probeSelector: {}
## Example which selects Probes with label "prometheus" set to "somelabel"
# probeSelector:
# matchLabels:
# prometheus: somelabel
## Namespaces to be selected for Probe discovery.
## See https://github.com/prometheus-operator/prometheus-operator/blob/master/Documentation/api.md#namespaceselector for usage
##
probeNamespaceSelector: {}
## How long to retain metrics
##
retention: 10d
## Maximum size of metrics
##
retentionSize: ""
## Enable compression of the write-ahead log using Snappy.
##
walCompression: false
## If true, the Operator won't process any Prometheus configuration changes
##
paused: false
## Number of replicas of each shard to deploy for a Prometheus deployment.
## Number of replicas multiplied by shards is the total number of Pods created.
##
replicas: 1
## EXPERIMENTAL: Number of shards to distribute targets onto.
## Number of replicas multiplied by shards is the total number of Pods created.
## Note that scaling down shards will not reshard data onto remaining instances, it must be manually moved.
## Increasing shards will not reshard data either but it will continue to be available from the same instances.
## To query globally use Thanos sidecar and Thanos querier or remote write data to a central location.
## Sharding is done on the content of the `__address__` target meta-label.
##
shards: 1
## Log level for Prometheus be configured in
##
logLevel: info
## Log format for Prometheus be configured in
##
logFormat: logfmt
## Prefix used to register routes, overriding externalUrl route.
## Useful for proxies that rewrite URLs.
##
routePrefix: /
## Standard object’s metadata. More info: https://github.com/kubernetes/community/blob/master/contributors/devel/sig-architecture/api-conventions.md#metadata
## Metadata Labels and Annotations gets propagated to the prometheus pods.
##
podMetadata: {}
# labels:
# app: prometheus
# k8s-app: prometheus
## Pod anti-affinity can prevent the scheduler from placing Prometheus replicas on the same node.
## The default value "soft" means that the scheduler should *prefer* to not schedule two replica pods onto the same node but no guarantee is provided.
## The value "hard" means that the scheduler is *required* to not schedule two replica pods onto the same node.
## The value "" will disable pod anti-affinity so that no anti-affinity rules will be configured.
podAntiAffinity: ""
## If anti-affinity is enabled sets the topologyKey to use for anti-affinity.
## This can be changed to, for example, failure-domain.beta.kubernetes.io/zone
##
podAntiAffinityTopologyKey: kubernetes.io/hostname
## Assign custom affinity rules to the prometheus instance
## ref: https://kubernetes.io/docs/concepts/configuration/assign-pod-node/
##
affinity: {}
# nodeAffinity:
# requiredDuringSchedulingIgnoredDuringExecution:
# nodeSelectorTerms:
# - matchExpressions:
# - key: kubernetes.io/e2e-az-name
# operator: In
# values:
# - e2e-az1
# - e2e-az2
## The remote_read spec configuration for Prometheus.
## ref: https://github.com/prometheus-operator/prometheus-operator/blob/master/Documentation/api.md#remotereadspec
remoteRead: []
# - url: http://remote1/read
## The remote_write spec configuration for Prometheus.
## ref: https://github.com/prometheus-operator/prometheus-operator/blob/master/Documentation/api.md#remotewritespec
remoteWrite: []
# - url: http://remote1/push
## Enable/Disable Grafana dashboards provisioning for prometheus remote write feature
remoteWriteDashboards: false
## Resource limits & requests
##
resources: {}
# requests:
# memory: 400Mi
## Prometheus StorageSpec for persistent data
## ref: https://github.com/prometheus-operator/prometheus-operator/blob/master/Documentation/user-guides/storage.md
##
storageSpec:
## Using PersistentVolumeClaim
##
volumeClaimTemplate:
spec:
storageClassName: nfs-storageclass
accessModes: ["ReadWriteMany"]
resources:
requests:
storage: 10Gi
# selector: {}
## Using tmpfs volume
##
# emptyDir:
# medium: Memory
# Additional volumes on the output StatefulSet definition.
volumes: []
# Additional VolumeMounts on the output StatefulSet definition.
volumeMounts: []
## AdditionalScrapeConfigs allows specifying additional Prometheus scrape configurations. Scrape configurations
## are appended to the configurations generated by the Prometheus Operator. Job configurations must have the form
## as specified in the official Prometheus documentation:
## https://prometheus.io/docs/prometheus/latest/configuration/configuration/#scrape_config. As scrape configs are
## appended, the user is responsible to make sure it is valid. Note that using this feature may expose the possibility
## to break upgrades of Prometheus. It is advised to review Prometheus release notes to ensure that no incompatible
## scrape configs are going to break Prometheus after the upgrade.
##
## The scrape configuration example below will find master nodes, provided they have the name .*mst.*, relabel the
## port to 2379 and allow etcd scraping provided it is running on all Kubernetes master nodes
##
additionalScrapeConfigs: []
# - job_name: kube-etcd
# kubernetes_sd_configs:
# - role: node
# scheme: https
# tls_config:
# ca_file: /etc/prometheus/secrets/etcd-client-cert/etcd-ca
# cert_file: /etc/prometheus/secrets/etcd-client-cert/etcd-client
# key_file: /etc/prometheus/secrets/etcd-client-cert/etcd-client-key
# relabel_configs:
# - action: labelmap
# regex: __meta_kubernetes_node_label_(.+)
# - source_labels: [__address__]
# action: replace
# targetLabel: __address__
# regex: ([^:;]+):(d+)
# replacement: ${1}:2379
# - source_labels: [__meta_kubernetes_node_name]
# action: keep
# regex: .*mst.*
# - source_labels: [__meta_kubernetes_node_name]
# action: replace
# targetLabel: node
# regex: (.*)
# replacement: ${1}
# metric_relabel_configs:
# - regex: (kubernetes_io_hostname|failure_domain_beta_kubernetes_io_region|beta_kubernetes_io_os|beta_kubernetes_io_arch|beta_kubernetes_io_instance_type|failure_domain_beta_kubernetes_io_zone)
# action: labeldrop
## If additional scrape configurations are already deployed in a single secret file you can use this section.
## Expected values are the secret name and key
## Cannot be used with additionalScrapeConfigs
additionalScrapeConfigsSecret: {}
# enabled: false
# name:
# key:
## additionalPrometheusSecretsAnnotations allows to add annotations to the kubernetes secret. This can be useful
## when deploying via spinnaker to disable versioning on the secret, strategy.spinnaker.io/versioned: 'false'
additionalPrometheusSecretsAnnotations: {}
## AdditionalAlertManagerConfigs allows for manual configuration of alertmanager jobs in the form as specified
## in the official Prometheus documentation https://prometheus.io/docs/prometheus/latest/configuration/configuration/#<alertmanager_config>.
## AlertManager configurations specified are appended to the configurations generated by the Prometheus Operator.
## As AlertManager configs are appended, the user is responsible to make sure it is valid. Note that using this
## feature may expose the possibility to break upgrades of Prometheus. It is advised to review Prometheus release
## notes to ensure that no incompatible AlertManager configs are going to break Prometheus after the upgrade.
##
additionalAlertManagerConfigs: []
# - consul_sd_configs:
# - server: consul.dev.test:8500
# scheme: http
# datacenter: dev
# tag_separator: ','
# services:
# - metrics-prometheus-alertmanager
## AdditionalAlertRelabelConfigs allows specifying Prometheus alert relabel configurations. Alert relabel configurations specified are appended
## to the configurations generated by the Prometheus Operator. Alert relabel configurations specified must have the form as specified in the
## official Prometheus documentation: https://prometheus.io/docs/prometheus/latest/configuration/configuration/#alert_relabel_configs.
## As alert relabel configs are appended, the user is responsible to make sure it is valid. Note that using this feature may expose the
## possibility to break upgrades of Prometheus. It is advised to review Prometheus release notes to ensure that no incompatible alert relabel
## configs are going to break Prometheus after the upgrade.
##
additionalAlertRelabelConfigs: []
# - separator: ;
# regex: prometheus_replica
# replacement: $1
# action: labeldrop
## SecurityContext holds pod-level security attributes and common container settings.
## This defaults to non root user with uid 1000 and gid 2000.
## https://github.com/prometheus-operator/prometheus-operator/blob/master/Documentation/api.md
##
securityContext:
runAsGroup: 2000
runAsNonRoot: true
runAsUser: 1000
fsGroup: 2000
## Priority class assigned to the Pods
##
priorityClassName: ""
## Thanos configuration allows configuring various aspects of a Prometheus server in a Thanos environment.
## This section is experimental, it may change significantly without deprecation notice in any release.
## This is experimental and may change significantly without backward compatibility in any release.
## ref: https://github.com/prometheus-operator/prometheus-operator/blob/master/Documentation/api.md#thanosspec
##
thanos: {}
## Containers allows injecting additional containers. This is meant to allow adding an authentication proxy to a Prometheus pod.
## if using proxy extraContainer update targetPort with proxy container port
containers: []
## InitContainers allows injecting additional initContainers. This is meant to allow doing some changes
## (permissions, dir tree) on mounted volumes before starting prometheus
initContainers: []
## PortName to use for Prometheus.
##
portName: "web"
## ArbitraryFSAccessThroughSMs configures whether configuration based on a service monitor can access arbitrary files
## on the file system of the Prometheus container e.g. bearer token files.
arbitraryFSAccessThroughSMs: false
## OverrideHonorLabels if set to true overrides all user configured honor_labels. If HonorLabels is set in ServiceMonitor
## or PodMonitor to true, this overrides honor_labels to false.
overrideHonorLabels: false
## OverrideHonorTimestamps allows to globally enforce honoring timestamps in all scrape configs.
overrideHonorTimestamps: false
## IgnoreNamespaceSelectors if set to true will ignore NamespaceSelector settings from the podmonitor and servicemonitor
## configs, and they will only discover endpoints within their current namespace. Defaults to false.
ignoreNamespaceSelectors: false
## PrometheusRulesExcludedFromEnforce - list of prometheus rules to be excluded from enforcing of adding namespace labels.
## Works only if enforcedNamespaceLabel set to true. Make sure both ruleNamespace and ruleName are set for each pair
prometheusRulesExcludedFromEnforce: false
## QueryLogFile specifies the file to which PromQL queries are logged. Note that this location must be writable,
## and can be persisted using an attached volume. Alternatively, the location can be set to a stdout location such
## as /dev/stdout to log querie information to the default Prometheus log stream. This is only available in versions
## of Prometheus >= 2.16.0. For more details, see the Prometheus docs (https://prometheus.io/docs/guides/query-log/)
queryLogFile: false
## EnforcedSampleLimit defines global limit on number of scraped samples that will be accepted. This overrides any SampleLimit
## set per ServiceMonitor or/and PodMonitor. It is meant to be used by admins to enforce the SampleLimit to keep overall
## number of samples/series under the desired limit. Note that if SampleLimit is lower that value will be taken instead.
enforcedSampleLimit: false
## AllowOverlappingBlocks enables vertical compaction and vertical query merge in Prometheus. This is still experimental
## in Prometheus so it may change in any upcoming release.
allowOverlappingBlocks: false
additionalRulesForClusterRole: []
# - apiGroups: [ "" ]
# resources:
# - nodes/proxy
# verbs: [ "get", "list", "watch" ]
additionalServiceMonitors: []
## Name of the ServiceMonitor to create
##
#- name: ""
## Additional labels to set used for the ServiceMonitorSelector. Together with standard labels from
## the chart
##
# additionalLabels: {}
## Service label for use in assembling a job name of the form <label value>-<port>
## If no label is specified, the service name is used.
##
# jobLabel: ""
## labels to transfer from the kubernetes service to the target
##
# targetLabels: []
## labels to transfer from the kubernetes pods to the target
##
# podTargetLabels: []
## Label selector for services to which this ServiceMonitor applies
##
# selector: {}
## Namespaces from which services are selected
##
# namespaceSelector: []
## Match any namespace
##
# any: false
## Explicit list of namespace names to select
##
# matchNames: []
## Endpoints of the selected service to be monitored
##
# endpoints: []
## Name of the endpoint's service port
## Mutually exclusive with targetPort
# - port: ""
## Name or number of the endpoint's target port
## Mutually exclusive with port
# - targetPort: ""
## File containing bearer token to be used when scraping targets
##
# bearerTokenFile: ""
## Interval at which metrics should be scraped
##
# interval: 30s
## HTTP path to scrape for metrics
##
# path: /metrics
## HTTP scheme to use for scraping
##
# scheme: http
## TLS configuration to use when scraping the endpoint
##
# tlsConfig:
## Path to the CA file
##
# caFile: ""
## Path to client certificate file
##
# certFile: ""
## Skip certificate verification
##
# insecureSkipVerify: false
## Path to client key file
##
# keyFile: ""
## Server name used to verify host name
##
# serverName: ""
additionalPodMonitors: []
## Name of the PodMonitor to create
##
# - name: ""
## Additional labels to set used for the PodMonitorSelector. Together with standard labels from
## the chart
##
# additionalLabels: {}
## Pod label for use in assembling a job name of the form <label value>-<port>
## If no label is specified, the pod endpoint name is used.
##
# jobLabel: ""
## Label selector for pods to which this PodMonitor applies
##
# selector: {}
## PodTargetLabels transfers labels on the Kubernetes Pod onto the target.
##
# podTargetLabels: {}
## SampleLimit defines per-scrape limit on number of scraped samples that will be accepted.
##
# sampleLimit: 0
## Namespaces from which pods are selected
##
# namespaceSelector:
## Match any namespace
##
# any: false
## Explicit list of namespace names to select
##
# matchNames: []
## Endpoints of the selected pods to be monitored
## https://github.com/prometheus-operator/prometheus-operator/blob/master/Documentation/api.md#podmetricsendpoint
##
# podMetricsEndpoints: []
Настроим Elasticsearch-exporter
он есть в том же репозитории: https://github.com/prometheus-community/helm-charts.git с которого мы запускали сам prometheus, лежит он тут:
es:

  uri: http://elasticsearch-master:9200


serviceMonitor:

  ## If true, a ServiceMonitor CRD is created for a prometheus operator

  ## https://github.com/coreos/prometheus-operator

  ##

  enabled: true

  namespace: monitoring

  labels:

    app: elasticsearch-master

    release: prometheus

  interval: 10s

  scrapeTimeout: 10s

  scheme: http

  relabelings: []

  targetLabels:

    app: elasticsearch-master

    release: prometheus

  metricRelabelings: []

  sampleLimit: 0
в полном виде конфиг выглядит так:
## number of exporter instances

##

replicaCount: 1


## restart policy for all containers

##

restartPolicy: Always


image:

  repository: justwatch/elasticsearch_exporter

  tag: 1.1.0

  pullPolicy: IfNotPresent

  pullSecret: ""


## Set enabled to false if you don't want securityContext

## in your Deployment.

## The below values are the default for kubernetes.

## Openshift won't deploy with runAsUser: 1000 without additional permissions.

securityContext:

  enabled: true  # Should be set to false when running on OpenShift

  runAsUser: 1000


# Custom DNS configuration to be added to prometheus-elasticsearch-exporter pods

dnsConfig: {}

# nameservers:

#   - 1.2.3.4

# searches:

#   - ns1.svc.cluster-domain.example

#   - my.dns.search.suffix

# options:

#   - name: ndots

#     value: "2"

#   - name: edns0


log:

  format: logfmt

  level: info


resources: {}

  # requests:

  #   cpu: 100m

  #   memory: 128Mi

  # limits:

  #   cpu: 100m

  #   memory: 128Mi


priorityClassName: ""


nodeSelector: {}


tolerations: []


podAnnotations: {}


podLabels: {}


affinity: {}


service:

  type: ClusterIP

  httpPort: 9108

  metricsPort:

    name: http

  annotations: {}

  labels: {}


## Extra environment variables that will be passed into the exporter pod

## example:

## env:

##   KEY_1: value1

##   KEY_2: value2

env: {}


## The name of a secret in the same kubernetes namespace which contain values to be added to the environment

## This can be useful for auth tokens, etc

envFromSecret: ""


## A list of environment variables from secret refs that will be passed into the exporter pod

## example:

## This will set ${ES_PASSWORD} to the 'password' key from the 'my-secret' secret

## extraEnvSecrets:

##   ES_PASSWORD:

##     secret: my-secret

##     key: password

extraEnvSecrets: {}


# A list of secrets and their paths to mount inside the pod

# This is useful for mounting certificates for security

secretMounts: []

#  - name: elastic-certs

#    secretName: elastic-certs

#    path: /ssl


# A list of additional Volume to add to the deployment

# this is useful if the volume you need is not a secret (csi volume etc.)

extraVolumes: []

#  - name: csi-volume

#    csi:

#      driver: secrets-store.csi.k8s.io

#      readOnly: true

#      volumeAttributes:

#        secretProviderClass: my-spc


#  A list of additional VolumeMounts to add to the deployment

#  this is useful for mounting any other needed resource into

#  the elasticsearch-exporter pod

extraVolumeMounts: []

#  - name: csi-volume

#    mountPath: /csi/volume

#    readOnly: true


es:

  ## Address (host and port) of the Elasticsearch node we should connect to.

  ## This could be a local node (localhost:9200, for instance), or the address

  ## of a remote Elasticsearch server. When basic auth is needed,

  ## specify as: <proto>://<user>:<password>@<host>:<port>. e.g., http://admin:pass@localhost:9200.

  ##

  uri: http://elasticsearch-master:9200


  ## If true, query stats for all nodes in the cluster, rather than just the

  ## node we connect to.

  ##

  all: true


  ## If true, query stats for all indices in the cluster.

  ##

  indices: true


  ## If true, query settings stats for all indices in the cluster.

  ##

  indices_settings: true


  ## If true, query stats for shards in the cluster.

  ##

  shards: true


  ## If true, query stats for snapshots in the cluster.

  ##

  snapshots: true


  ## If true, query stats for cluster settings.

  ##

  cluster_settings: false


  ## Timeout for trying to get stats from Elasticsearch. (ex: 20s)

  ##

  timeout: 30s


  ## Skip SSL verification when connecting to Elasticsearch

  ## (only available if image.tag >= 1.0.4rc1)

  ##

  sslSkipVerify: false


  ssl:

    ## If true, a secure connection to ES cluster is used

    ##

    enabled: false


    ## If true, certs from secretMounts will be need to be referenced instead of certs below

    ##

    useExistingSecrets: false


    ca:


      ## PEM that contains trusted CAs used for setting up secure Elasticsearch connection

      ##

      # pem:


      # Path of ca pem file which should match a secretMount path

      path: /ssl/ca.pem

    client:

      ## if true, client SSL certificate is used for authentication

      ##

      enabled: true


      ## PEM that contains the client cert to connect to Elasticsearch.

      ##

      # pem:


      # Path of client pem file which should match a secretMount path

      pemPath: /ssl/client.pem


      ## Private key for client auth when connecting to Elasticsearch

      ##

      # key:


      # Path of client key file which should match a secretMount path

      keyPath: /ssl/client.key

web:

  ## Path under which to expose metrics.

  ##

  path: /metrics


serviceMonitor:

  ## If true, a ServiceMonitor CRD is created for a prometheus operator

  ## https://github.com/coreos/prometheus-operator

  ##

  enabled: true

  namespace: monitoring

  labels:

    app: elasticsearch-master

    release: prometheus

  interval: 10s

  scrapeTimeout: 10s

  scheme: http

  relabelings: []

  targetLabels:

    app: elasticsearch-master

    release: prometheus

  metricRelabelings: []

  sampleLimit: 0


prometheusRule:

  ## If true, a PrometheusRule CRD is created for a prometheus operator

  ## https://github.com/coreos/prometheus-operator

  ##

  ## The rules will be processed as Helm template, allowing to set variables in them.

  enabled: false

  #  namespace: monitoring

  labels: {}

  rules: []

    # - record: elasticsearch_filesystem_data_used_percent

    #   expr: |

    #     100 * (elasticsearch_filesystem_data_size_bytes{service="{{ template "elasticsearch-exporter.fullname" . }}"} - elasticsearch_filesystem_data_free_bytes{service="{{ template "elasticsearch-exporter.fullname" . }}"})

    #     / elasticsearch_filesystem_data_size_bytes{service="{{ template "elasticsearch-exporter.fullname" . }}"}

    # - record: elasticsearch_filesystem_data_free_percent

    #   expr: 100 - elasticsearch_filesystem_data_used_percent{service="{{ template "elasticsearch-exporter.fullname" . }}"}

    # - alert: ElasticsearchTooFewNodesRunning

    #   expr: elasticsearch_cluster_health_number_of_nodes{service="{{ template "elasticsearch-exporter.fullname" . }}"} < 3

    #   for: 5m

    #   labels:

    #     severity: critical

    #   annotations:

    #     description: There are only {{ "{{ $value }}" }} < 3 ElasticSearch nodes running

    #     summary: ElasticSearch running on less than 3 nodes

    # - alert: ElasticsearchHeapTooHigh

    #   expr: |

    #     elasticsearch_jvm_memory_used_bytes{service="{{ template "elasticsearch-exporter.fullname" . }}", area="heap"} / elasticsearch_jvm_memory_max_bytes{service="{{ template "elasticsearch-exporter.fullname" . }}", area="heap"}

    #     > 0.9

    #   for: 15m

    #   labels:

    #     severity: critical

    #   annotations:

    #     description: The heap usage is over 90% for 15m

    #     summary: ElasticSearch node {{ "{{ $labels.node }}" }} heap usage is high


# Create a service account

# To use a service account not handled by the chart, set the name here

# and set create to false

serviceAccount:

  create: false

  name: default


# Creates a PodSecurityPolicy and the role/rolebinding

# allowing the serviceaccount to use it

podSecurityPolicies:

  enabled: false
прогоняем label по всем namespace kubectl label namespace —all «prometheus=enabled»
у меня уже установлен redis в кластере в namespace redis, прометеус в namespace monitoring
пароль от redis у меня закрыт в секрете:
[root@prod-vsrv-kubemaster1 charts]# kubectl get secrets -n redis  | grep -E 'NAME|password'

NAME                                                   TYPE                                  DATA   AGE

redis-password                                         Opaque                                1      27h
vim prometheus-redis-exporter/values.yaml
redisAddress: redis://redis-cluster-headless.redis.svc.test.local:6379


serviceMonitor:

  enabled: true

  namespace: monitoring

  # Set labels for the ServiceMonitor, use this to define your scrape label for Prometheus Operator

  labels:

    release: prometheus


auth:

  # Use password authentication

  enabled: true

  # Use existing secret (ignores redisPassword)

  secret:

    name: redis-password

    key: redis-password
/newbot — отправляем ему и бот просит придумать имя нашему новому боту. Единственное ограничение на имя — оно должно оканчиваться на «bot». В случае успеха BotFather возвращает токен бота и ссылку для быстрого добавления бота в контакты, иначе придется поломать голову над именем.
всё мы зарегались, теперь этот токен можно использовать при подключении нашего алертменеджера к телеграму
cat default.tmpl
{{ define "telegram.default" }}

{{ range .Alerts }}

{{ if eq .Status "firing"}}?  <b>{{ .Status | toUpper }}</b> ? {{ else }}<b>{{ .Status | toUpper }}</b>{{ end }}

<b>{{ .Labels.alertname }}</b>

{{ .Annotations.message }} {{ .Annotations.description }}

<b>Duration:</b> {{ duration .StartsAt .EndsAt }}{{ if ne .Status "firing"}}

<b>Ended:</b> {{ .EndsAt | since }}{{ end }}

{{ end }}

{{ end }}
cat Dockerfile
FROM metalmatze/alertmanager-bot:0.4.2


COPY ./default.tmpl /templates/default.tmpl
admin1 — тут указываю хэши id пользователей которые будут заходить token — тут указываем токен нашего телеграм бота (хэш) namespace — тут указываем неймспейс в котором у нас запущен prometheus image — тут указываем образ телеграмбота пересобранного и загруженного в наш гитлаб — —telegram.admin — тут id пользователей в открытом виде
можем запускать: kubectl apply -f telegrambot.yml
всё можно проверять: пишем /start и бот отвечает:
6.1 настройка оповещений в telegram, в различные чаты(группы)
Задача — настроить оповещения в разные чаты телеграмма
за основу будет взят телеграм бот: https://github.com/inCaller/prometheus_bot который был заточен под helm chart https://github.com/gvych/telegram-bot-helm-chart отмечу сразу что его надо дописывать в values так как с нуля он не стартует.
приступим, создаём в телеграм новую группу:
добавляем нашего бота которого мы создали в предыдущем пункте, так как я дополняю статью позже, то имя бота у меня другое:
далее добавляем к группе бота который позволит увидеть chatid
6.2. настройка оповещений в telegram разграничение оповещений по группам (исключения уведомлений)
Вводная: есть админский чат и есть чат разработчиков. при настройке как в пункте 6.1 уведомления приходящие в чат разрабочиков дублируются и в чат админов.
данная ситуация происходит вообще потому, что alertmanager со следующим конфигом:
имеет настройку continue: true (по дефолту false) благодаря которой уведомления попав под первое правило не прекращаются а отправляются дальше по route и отправляются по другим receiver (когда совпадают по label)
правила совпадения работают не как OR а как AND (т.е. должны совпасть ВСЕ лейблы)
Задача, исключить из чата админов сообщения отправляемые в чат разрабочиков, чтобы админам прилетали все дефолтные
Решение — возможно тупенькое но я другого не нашёл, работать будет так:
прилетает сообщение, с лейблами: severity: «critical» team: «terminal-soft»
значит оно должно попасть только в группу terminal-soft, поэтому для receiver: «telegram-terminal-soft» оставляем match_re: team: «terminal-soft»
но так как в уведомлении будет прителать лейбл severity: «critical» то он будет попадать под совпадение receiver: «telegram-admins» у которого match_re: severity: «critical|warning»
нам этого не нужно поэтому для receiver: «telegram-terminal-soft» ставим continue: false и тогда обработка следующих routes не будет происходить.
вывод перед админским чатом правило должно быть с условием: continue: false а админский чат последний в списке.
а прометеус лезет на айпишник т.е. щимится на ноды а там ни кто не отвечает: [root@kub-master-1 charts]# telnet 192.168.1.205 10249 Trying 192.168.1.205… telnet: connect to address 192.168.1.205: Connection refused
что для исправления делаем, НА ВСЕХ НОДАХ правим:
[root@kub-master-1 charts]# vim /etc/kubernetes/kube-proxy-config.yaml c metricsBindAddress: 127.0.0.1:10249 на metricsBindAddress: 0.0.0.0:10249
[root@kub-master-1 charts]# kubectl delete pod -n kube-system kube-proxy-kub-master-1 kube-proxy-kub-master-2 kube-proxy-kub-master-3 kube-proxy-kub-worker-1 kube-proxy-kub-worker-2 pod «kube-proxy-kub-master-1» deleted pod «kube-proxy-kub-master-2» deleted pod «kube-proxy-kub-master-3» deleted pod «kube-proxy-kub-worker-1» deleted pod «kube-proxy-kub-worker-2» deleted
Проверяем доступность:
[root@kub-master-1 charts]# telnet 192.168.1.205 10249 Trying 192.168.1.205… Connected to 192.168.1.205. Escape character is ‘^]’. ^] telnet> quit Connection closed.
и как видим метрики теперь отображаются:
8.Настройка алерта для определённого namespace
У меня есть тестовый сервис:
cat my-site-ingress.yaml
---

apiVersion: extensions/v1beta1

kind: Ingress

metadata:

  name: my-ingress

  namespace: my-site

spec:

  rules:

  - host: test.ru  #тут указывается наш домен

    http:

      paths:  #список путей которые хотим обслуживать(он дефолтный и все запросы будут отправляться на бэкенд, т.е. на сервис my-service-apache)

      - backend:

          serviceName: my-service-apache  #тут указывается наш сервис

          servicePort: 80 #порт на котором сервис слушает

#        path: /  все запросы на корень '/' будут уходить на наш сервис
cat my-site-service.yaml
---

apiVersion: v1

kind: Service

metadata:

  name: my-service-apache # имя сервиса

  namespace: my-site

spec:

  ports:

  - port: 80  # принимать на 80

    targetPort: 80 # отправлять на 80

  selector:

    app: apache  #отправлять на все поды с данным лейблом

  type: ClusterIP
cat my-site.yaml
---

apiVersion: apps/v1

kind: Deployment

metadata:

  name: my-deployment-apache

  namespace: my-site

spec:

  replicas: 1

  selector:

    matchLabels:

      app: apache # по вот этому лейблу репликасет цепляет под

# тут описывается каким мокаром следует обновлять поды

  strategy:

    rollingUpdate:

      maxSurge: 1  # указывает на какое количество реплик можно увеличить

      maxUnavailable: 1 # указывает на какое количество реплик можно уменьшить

#т.е. в одно время при обновлении, будет увеличено на один (новый под) и уменьшено на один (старый под)

    type: RollingUpdate

## тут начинается описание контейнера

  template:

    metadata:

      labels:

        app: apache  # по вот этому лейблу репликасет цепляет под

    spec:

      containers:

        - image: httpd:2.4.43

          name: apache

          ports:

            - containerPort: 80

# тут начинаются проверки по доступности

          readinessProbe: # проверка готово ли приложение

            failureThreshold: 3 #указывает количество провалов при проверке

            httpGet:  # по сути дёргает курлом на 80 порт

              path: /

              port: 80

            periodSeconds: 10 #как часто должна проходить проверка (в секундах)

            successThreshold: 1 #сбрасывает счётчик неудач, т.е. при 3х проверках если 1 раз успешно прошло, то счётчик сбрасывается и всё ок

            timeoutSeconds: 1 #таймаут на выполнение пробы 1 секунда

          livenessProbe: #проверка на жизнь приложения, живо ли оно

            failureThreshold: 3

            httpGet:

              path: /

              port: 80

            periodSeconds: 10

            successThreshold: 1

            timeoutSeconds: 1

            initialDelaySeconds: 10 #означает что первую проверку надо сделать только после 10 секунд


# тут начинается описание лимитов для пода

          resources:

            requests: #количество ресурсов которые резервируются для pod на ноде

              cpu: 60m

              memory: 200Mi

            limits: #количество ресурсов которые pod может использовать(верхняя граница)

              cpu: 120m

              memory: 300Mi
[root@kub-master-1 ~]# kubectl get pod -n my-site

NAME                                    READY   STATUS    RESTARTS   AGE

my-deployment-apache-859486bd8c-zk99f   1/1     Running   0          11m
как видим всё ок. теперь сделаем так чтобы сервис постоянно падал и перезапускался, для этого подправим в деплойменте проверки(readinessProbe/livenessProbe) порта не 80 а 81:
cat my-site.yaml

---

apiVersion: apps/v1

kind: Deployment

metadata:

  name: my-deployment-apache

  namespace: my-site

spec:

  replicas: 1

  selector:

    matchLabels:

      app: apache # по вот этому лейблу репликасет цепляет под

# тут описывается каким мокаром следует обновлять поды

  strategy:

    rollingUpdate:

      maxSurge: 1  # указывает на какое количество реплик можно увеличить

      maxUnavailable: 1 # указывает на какое количество реплик можно уменьшить

#т.е. в одно время при обновлении, будет увеличено на один (новый под) и уменьшено на один (старый под)

    type: RollingUpdate

## тут начинается описание контейнера

  template:

    metadata:

      labels:

        app: apache  # по вот этому лейблу репликасет цепляет под

    spec:

      containers:

        - image: httpd:2.4.43

          name: apache

          ports:

            - containerPort: 80

# тут начинаются проверки по доступности

          readinessProbe: # проверка готово ли приложение

            failureThreshold: 3 #указывает количество провалов при проверке

            httpGet:  # по сути дёргает курлом на 80 порт

              path: /

              port: 81

            periodSeconds: 10 #как часто должна проходить проверка (в секундах)

            successThreshold: 1 #сбрасывает счётчик неудач, т.е. при 3х проверках если 1 раз успешно прошло, то счётчик сбрасывается и всё ок

            timeoutSeconds: 1 #таймаут на выполнение пробы 1 секунда

          livenessProbe: #проверка на жизнь приложения, живо ли оно

            failureThreshold: 3

            httpGet:

              path: /

              port: 81

            periodSeconds: 10

            successThreshold: 1

            timeoutSeconds: 1

            initialDelaySeconds: 10 #означает что первую проверку надо сделать только после 10 секунд


# тут начинается описание лимитов для пода

          resources:

            requests: #количество ресурсов которые резервируются для pod на ноде

              cpu: 60m

              memory: 200Mi

            limits: #количество ресурсов которые pod может использовать(верхняя граница)

              cpu: 120m

              memory: 300Mi
и применим:
kubectl apply -f my-site.yaml
как видим pod перезапускается:
[root@kub-master-1 ~]# kubectl get pod -n my-site

NAME                                    READY   STATUS    RESTARTS   AGE

my-deployment-apache-85978bf68f-mbwlm   0/1     Running   1          41s
который смотрит статус контейнеров по namespace my-site за последние 5 минут.
как видим у нас 2 разных имени контейнера: my-deployment-apache-859486bd8c-zk99f (который был запущен ранее и с ним было всё нормально) и my-deployment-apache-85978bf68f-mbwlm (текущий, который был специально сломан через неправильные проверки)
теперь нам надо получить результат, были ли за последние 5 минуть незапущенные контейнеры, для этого используем следующий запрос:
spec:

  groups:

  - name: alertmanager.rules

    rules:

    - alert: AlertmanagerConfigInconsistent

      annotations:

        message: |

          The configuration of the instances of the Alertmanager cluster `{{ $labels.namespace }}/{{ $labels.service }}` are out of sync.

          {{ range printf "alertmanager_config_hash{namespace="%s",service="%s"}" $labels.namespace $labels.service | query }}

          Configuration hash for pod {{ .Labels.pod }} is "{{ printf "%.f" .Value }}"

          {{ end }}

      expr: count by(namespace,service) (count_values by(namespace,service) ("config_hash",

        alertmanager_config_hash{job="prometheus-kube-prometheus-alertmanager",namespace="monitoring"}))

        != 1

      for: 5m

      labels:

        severity: critical

    - alert: AlertmanagerFailedReload

      annotations:

        message: Reloading Alertmanager's configuration has failed for {{ $labels.namespace

          }}/{{ $labels.pod}}.

      expr: alertmanager_config_last_reload_successful{job="prometheus-kube-prometheus-alertmanager",namespace="monitoring"}

        == 0

      for: 10m

      labels:

        severity: warning

    - alert: AlertmanagerMembersInconsistent

      annotations:

        message: Alertmanager has not found all other members of the cluster.

      expr: |-

        alertmanager_cluster_members{job="prometheus-kube-prometheus-alertmanager",namespace="monitoring"}

          != on (service) GROUP_LEFT()

        count by (service) (alertmanager_cluster_members{job="prometheus-kube-prometheus-alertmanager",namespace="monitoring"})

      for: 5m

      labels:

        severity: critical
в прометеусе переходим на вкладку alerts и видим наше правило:
всё теперь можно снова ломать проверки в нашем деплойменте и проверять полетел ли алерт:
как видим полетел.
проверяем наш телеграм бот и видим:
в таком вот виде настраивается алертинг.
Теперь рассмотрим как нам добавлять свой алертинг а не править имеющийся.
смотрим имеющие правила:
[root@kub-master-1 ~]# kubectl -n monitoring get prometheusrules.monitoring.coreos.com

NAME                                                              AGE

prometheus-kube-prometheus-alertmanager.rules                     3d

prometheus-kube-prometheus-etcd                                   3d

prometheus-kube-prometheus-general.rules                          3d

prometheus-kube-prometheus-k8s.rules                              3d

prometheus-kube-prometheus-kube-apiserver-availability.rules      3d

prometheus-kube-prometheus-kube-apiserver-slos                    3d

prometheus-kube-prometheus-kube-apiserver.rules                   3d

prometheus-kube-prometheus-kube-prometheus-general.rules          3d

prometheus-kube-prometheus-kube-prometheus-node-recording.rules   3d

prometheus-kube-prometheus-kube-scheduler.rules                   3d

prometheus-kube-prometheus-kube-state-metrics                     3d

prometheus-kube-prometheus-kubelet.rules                          3d

prometheus-kube-prometheus-kubernetes-apps                        3d

prometheus-kube-prometheus-kubernetes-resources                   3d

prometheus-kube-prometheus-kubernetes-storage                     3d

prometheus-kube-prometheus-kubernetes-system                      3d

prometheus-kube-prometheus-kubernetes-system-apiserver            3d

prometheus-kube-prometheus-kubernetes-system-controller-manager   3d

prometheus-kube-prometheus-kubernetes-system-kubelet              3d

prometheus-kube-prometheus-kubernetes-system-scheduler            3d

prometheus-kube-prometheus-node-exporter                          3d

prometheus-kube-prometheus-node-exporter.rules                    3d

prometheus-kube-prometheus-node-network                           3d

prometheus-kube-prometheus-node.rules                             3d

prometheus-kube-prometheus-prometheus                             3d

prometheus-kube-prometheus-prometheus-operator                    3d
smtp_smarthost: 10.20.44.56:25 это наш smtp хост через который мы шлём почту.
receiver: ’email_unixadmins’ — на него будут идти оповещения вне зависимости от критичности алерта, для остальных можно выставлять уровень критичности.
она будет отображать только наш неймспейс terminal-soft создадим панель которая будет отображать сколько процессорного времени использует namespace запрос выглядит следующим образом:
в левой колонке ставим параметр, в чём измеряем (в нашем случае в байтах)
и настраиваем отображаему легенду а именно минимальные максимальные значение и т.д.
всё можно сохраняться
как видим 2 графика у нас уже отображаются нормально:
теперь отобразим занятое дисковое пространство persistantvolume
создаём новую панель
запрос будет выглядеть следующим образом: (kubelet_volume_stats_capacity_bytes{persistentvolumeclaim=»$volume»} — kubelet_volume_stats_available_bytes{persistentvolumeclaim=»$volume»}) / kubelet_volume_stats_capacity_bytes{persistentvolumeclaim=»$volume»} * 100
у нас повилась переменная volume рассмотрим как её создать:
переходим в настройки dasboard
добавим несколько переменных, первая cluster запрос: label_values(kubelet_volume_stats_capacity_bytes, cluster)
не забываем ставить Hide Variables чтобы в панели он не отображался