Системы мониторинга наподобие Prometheus устанавливаются не только для того чтобы иметь красивые графики состояния сервера в определённый момент, но чтобы вовремя узнавать о возможных проблемах. Для этого у таких систем существуют уведомления — алерты. Prometheus тоже умеет генерировать алерты на основе настраиваемых правил, однако если состояние сервера совпадает с правилом Prometheus будет генерировать алерт при каждом обновлении.
Это не очень удобное поведение, потому что если проблема будет сохранятся долго, вся почта будет заспамлена однообразными сообщениями. Поэтому существует Alertmanager. Это программа из того же пакета что и Prometheus, она позволяет сортировать алерты и отправлять сообщения только первый раз
НАСТРОЙКА ALERTMANAGER ДЛЯ PROMETHEUS
1. НАСТРОЙКА ПРАВИЛ PROMETHEUS
Первым делом необходимо настроить правила Prometheus чтобы программа генерировала алерты при возникновении тех или иных событий. Для правил надо создать отдельный файл в папке с конфигурацией prometheus, например, rules.yaml:
sudo vi /etc/prometheus/rules.yaml
groups:

  - name: имя_группы

    rules:
Файл должен содержать данные в формате yaml. Все правила разбиты на группы. У каждой группы есть имя (name) и список правил (rules). Сначала посмотрим на общий синтаксис правила:
- alert: название_правила

    expr: выражение_при_истинности_которого_отправится_алерт

    for: алерт_будет_отправлен_если_выражение_держится_указанное_время

    labels:

      severity: уровень_важности

    annotations:

      summary: заголовок_алерта

      description: "Подробное описание алерта {{ $переменная }}"
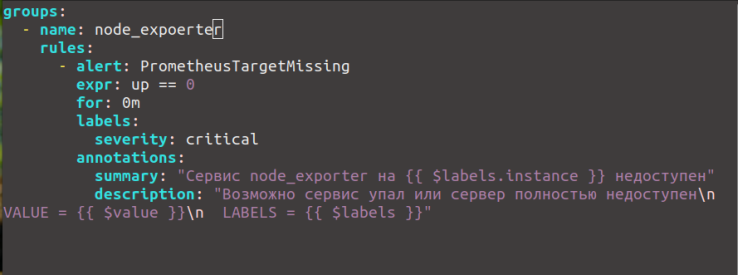
рассмотрим простое правило, отправлять алерт, если хост недоступен:
- alert: PrometheusTargetMissing

    expr: up == 0

    for: 0m

    labels:

      severity: critical

    annotations:

      summary: "Сервис node_exporter на сервере {{ $labels.instance }} недоступен"

      description: "Возможно сервис node_exporter упал или сервер недоступенn VALUE = {{ $value }}n LABELS = {{ $labels }}"
Думаю здесь всё понятно, правило называется PrometheusTargetMissing, дальше идёт условие up == 0. Здесь up это внутренняя метрика prometheus, но здесь можно использовать и метрики предоставляемые экспортёрами. Дальше в параметре for задается время, на протяжении которого проблема должна сохранятся для того чтобы отправить уведомление. Затем идёт описание алерта. В описании можно использовать переменные. Вот они:
- {{$value}} — содержит значение переменной, участвующей в выражении;
- {{$labels.instance}} — IP адрес и порт экспортёра, с которым возникла проблема;
- {{$labels.job}} — имя задачи из конфигурационного файла prometheus;
В конфигурационном файле это правило будет выглядеть вот так:
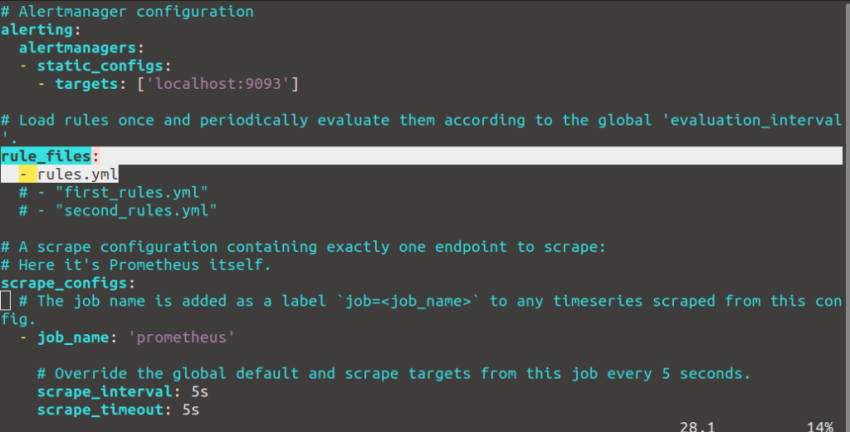
Этого правила хватит для тестирования alertmanager в этой статье. Больше полезных правил вы можете найти здесь. Теперь осталось добавить созданный файл с правилами в основной файл конфигурации prometheus. Для этого добавьте в него такие строчки:
sudo vi /etc/prometheus/prometheus.yml
rule_files:

  - rules.yml
атем нужно проверить созданные правила, для этого выполните команду:
promtool check rules /etc/prometheus/rules.yml
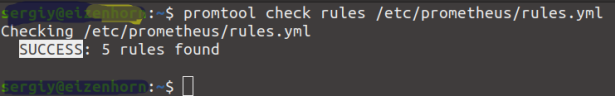
Если всё прошло успешно, команда выведет слово SUCCESS и количество найденных правил. Если возникла ошибка, убедитесь что у вас верно расставлены отступы, формат YAML очень к нем чувствителен. Все элементы одной группы должны быть на одном уроне.
После внесения всех изменений перезапустите Prometheus:
sudo systemctl restart prometheus
2. УСТАНОВКА ALERTMANAGER
Установить Alertmanager можно из официальных репозториев, но так вы получите программу более старой версии и без веб-интерфейса. Для установки выполните команду:
yum install prometheus-alertmanager
После завершения установки веб-интерфейс можно развернуть командой:
/usr/share/prometheus/alertmanager/generate-ui.sh
Или же можно установить программу из официального сайта. Как и другие программы из этой экосистемы, alertmanager написан на Golang, поэтому состоит из одного исполняемого файла и нескольких конфигурационных файлов. Он не зависит от установленных в системе библиотек.
Сначала скачайте архив с исполняемыми файлами alertmanager из официальной страницы github, например:
wget https://github.com/prometheus/alertmanager/releases/download/v0.21.0/alertmanager-0.21.0.linux-amd64.tar.gz
Дальше распакуйте полученный архив:
tar -xvf alertmanager-0.21.0.linux-amd64.tar.gz
И скопируйте файлы alertmanager и amtool в папку /usr/local/bin:
sudo cp alertmanager-0.21.0.linux-amd64/alertmanager /usr/local/bin/sudo cp alertmanager-0.21.0.linux-amd64/amtool /usr/local/bin/
Далее надо скопировать конфигурационный файл alertmanager.yml в /etc/prometheus:
sudo cp alertmanager-0.21.0.linux-amd64/alertmanager.yml /etc/prometheus
Дайте пользователю prometheus права на конфигурационный файл:
sudo chown -R prometheus:prometheus /etc/prometheus/alertmanager.yml
Осталось создать systemd сервис, с помощью которого вы сможете запускать программу.
sudo systemctl edit --full --force prometheus-alertmanager
[Unit]

Description=Alertmanager Service

After=network.target

[Service]

EnvironmentFile=-/etc/default/alertmanager

User=prometheus

Group=prometheus

Type=simple

ExecStart=/usr/local/bin/alertmanager $ARGS

ExecReload=/bin/kill -HUP $MAINPID

Restart=on-failure

[Install]

WantedBy=multi-user.target
Теперь можете запустить сервис:
sudo systemctl start prometheus-alertmanager
Веб-интерфейс будет доступен на порту 9093:
3. НАСТРОЙКА PROMETHEUS
Дальше необходимо убедится, что в конфигурационном файле prometheus прописана отправка алертов в alertmanager. Найдите в нём или добавьте такую секцию:
sudo vi /etc/prometheus/alertmanager.yml
alerting:

  alertmanagers:

  - static_configs:

    - targets: ['localhost:9093']
Если были внесены изменения, то prometheus надо перезапустить:
sudo systemctl restart prometheus
4. НАСТРОЙКА ALERTMANAGER
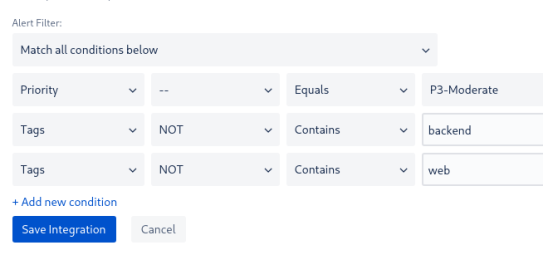
Почти всё готово, теперь надо настроить сам Alertmanager. Надо указать как группировать алерты, когда и куда отправлять уведомления. Вот основное содержание конфигурационного файла:
global:

route:

  group_by: ['по каким параметрам группировать правила']

  group_wait: время_ожидания_перед_отправкой_уведомления_для_группы

  group_interval: время_отправки_повторного_сообщения_для_группы

  repeat_interval: время_до_отправки_повторного_сообщения

  receiver: 'имя_способа_отправки_сообщений'

receivers:

  - name: 'имя_способа_отправки_сообщений'

    конфигурация
Все алерты, поступившие в AlertManager необходимо группировать чтобы не отправлять информацию об одних и тех же событиях несколько раз. Директива group_by указывает какие поля использовать во время группировки. После того, как была создана новая группа алертов, к делу подключается параметр group_wait. Он указывает сколько надо ждать перед отправкой первого сообщения. Параметр отвечает за то, чтобы вы могли получить одним сообщением всю пачку алертов группы, а не отдельное сообщение для каждого алерта.
Параметр group_interval указывает сколько надо ждать после отправки первого сообщения для группы, до отправки повторных сообщений из этой же группы. Но не только он влияет на интервал между сообщениями, ещё есть параметр repeat_interval — который указывает через сколько времени можно повторить отправку уже отправленного алерта.
Вот рабочий пример конфигурации с отправкой уведомлений на email:
sudo vi /etc/prometheus/alertmanager.yml
global:

route:

  group_by: ['alertname']

  group_wait: 30s

  group_interval: 10m

  repeat_interval: 60m

  receiver: 'email'

receivers:

- name: 'email'

  email_configs:

  - to: 'адрес_электронной_почты_получателя'

    from: 'адрес_электронной_почты_отправителя'

    smarthost: 'SMTP_хост:порт'

    auth_username: 'имя_пользователя'

    auth_identity: 'имя_пользователя'

    auth_password: 'пароль'
Все алерты группируются по имени, а значит если для двух разных сереров придут алерты с одинаковым именем, они будут помещены в одну группу. Группа собирается на протяжении 30 секунд, и отправлять повторные сообщения можно не чаще чем раз в час. Дальше идёт настройка отправки сообщений на электронную почту. Для этого используется протокол SMTP. Необходимо указать хост SMTP сервера, имя пользователя и пароль. Вы можете использовать свой SMTP сервер, настроенный на Postfix или Exim или же воспользоваться сторонним сервисом.
Дальше нужно только перезапустить Alertmanager:
sudo systemctl restart prometheus-alertmanager
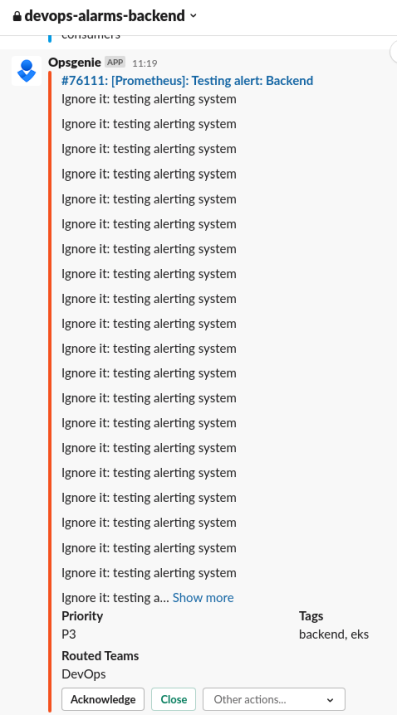
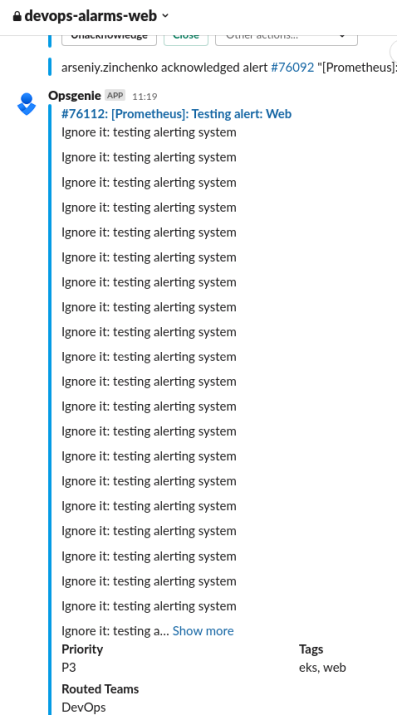
5. ТЕСТИРОВАНИЕ
Для тестирования на одном из серверов, с которых собирает данные Prometheus можно отключить node_exporter. Для этого выполните:
sudo systemctl stop prometheus-node-exporter
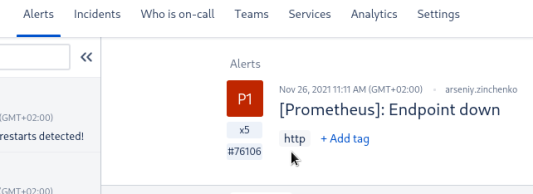
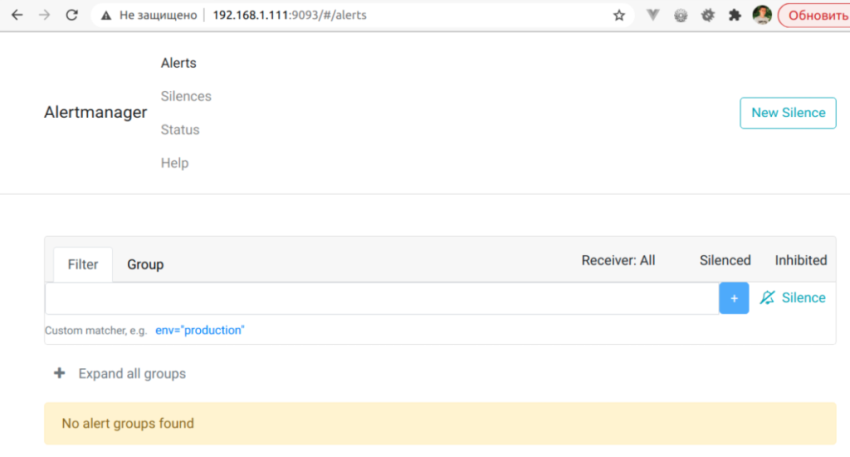
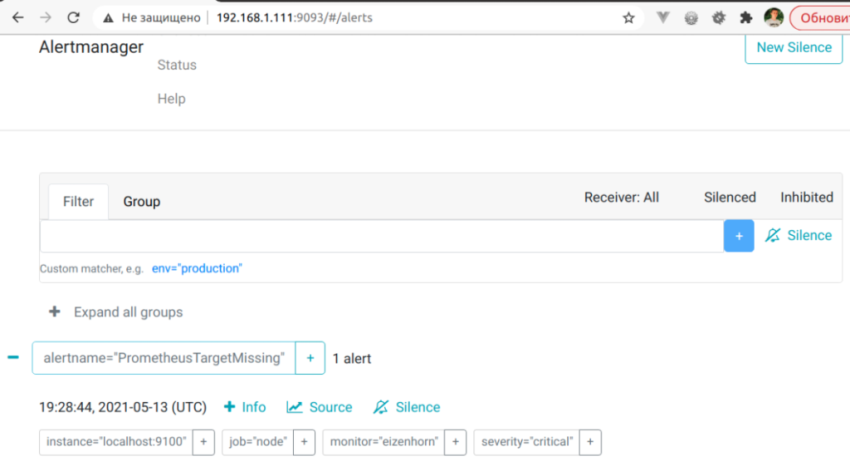
Подождите пока Prometheus снова опросит цели и в AlertManager появится этот алерт:
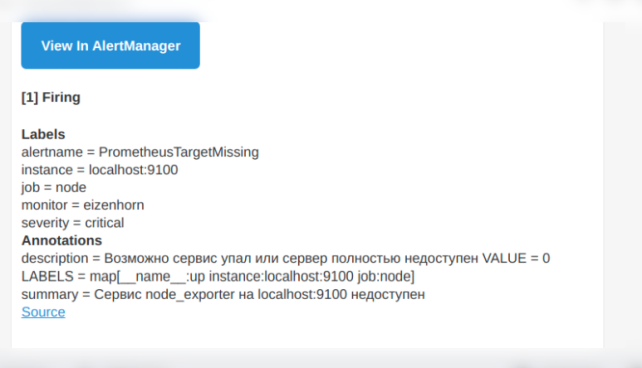
Сразу же он придет вам на почту:
Источник: https://sidmid.ru/настройка-alertmanager-prometheus/