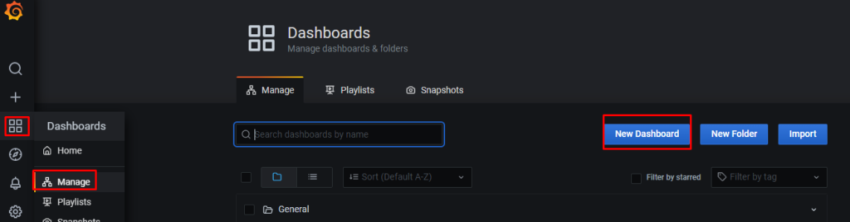
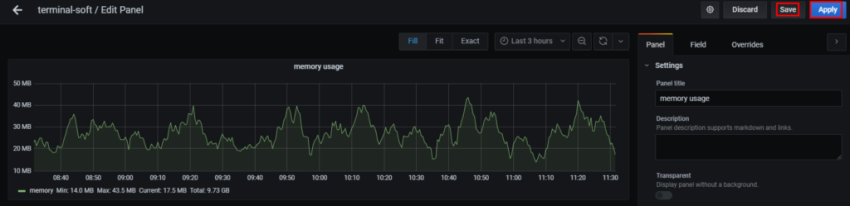
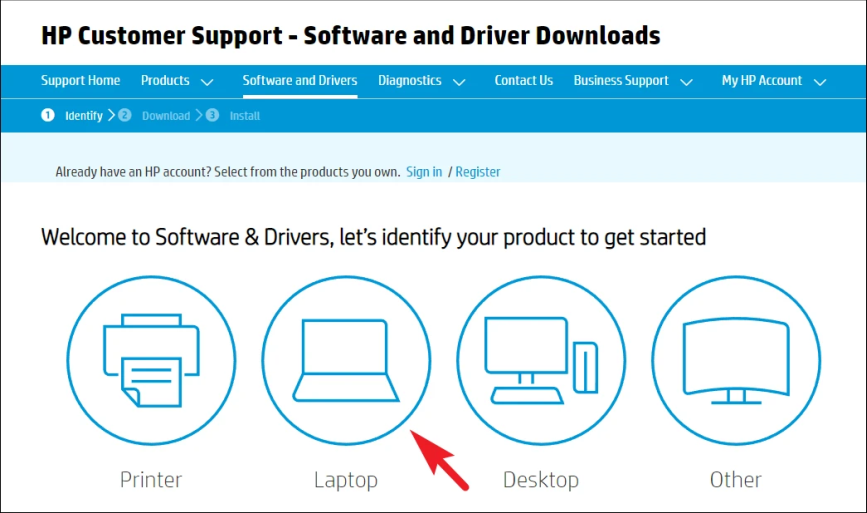
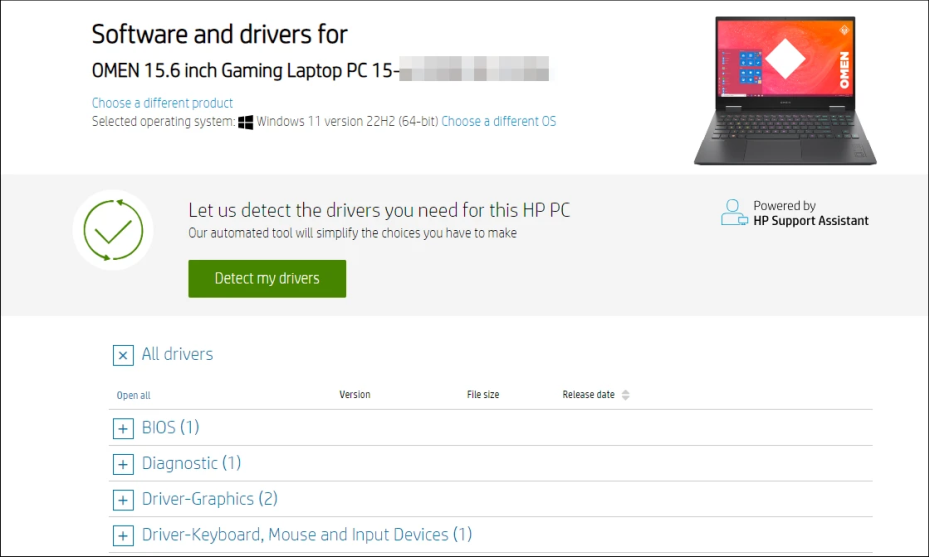
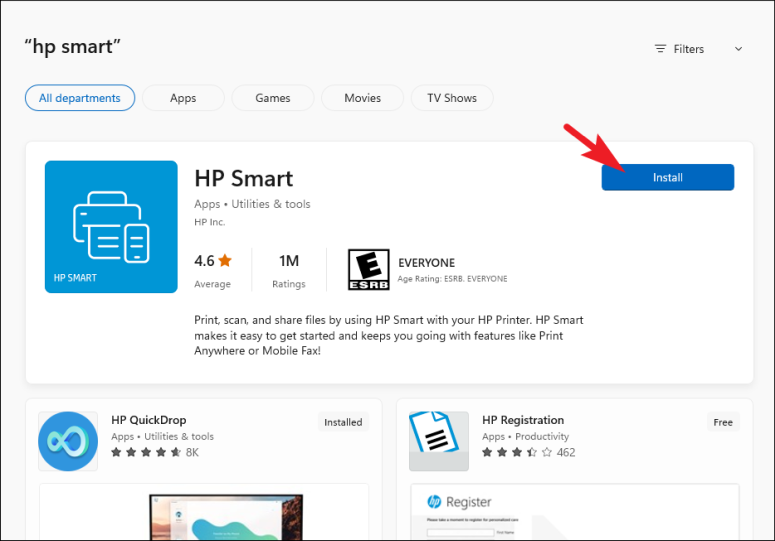
Задача – добавить дашборд для отображения различной статистики с бекенда.
Ниже описывается процесс создания дашборды, рассматриваются примеры запросов из Grafana к Prometheus для получения данных, настройки различных типов панелей, примеры метрик, которые можно использовать.
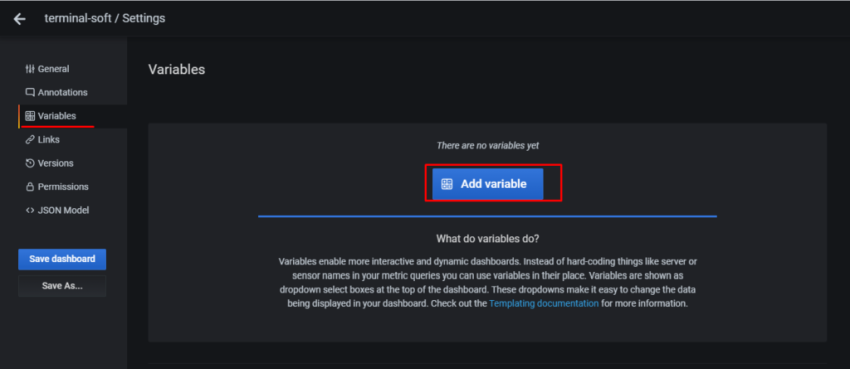
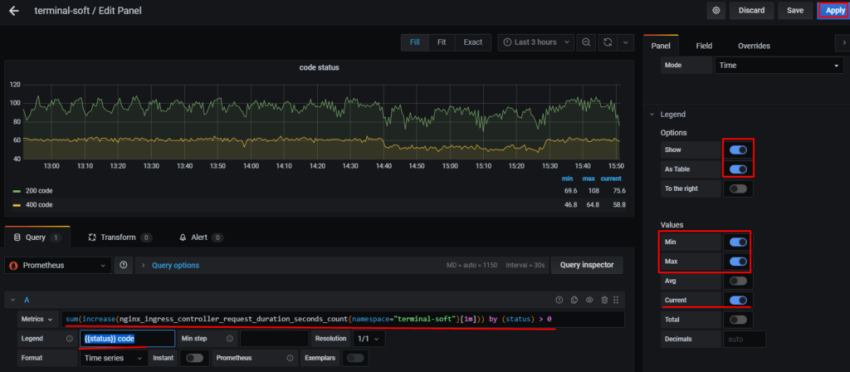
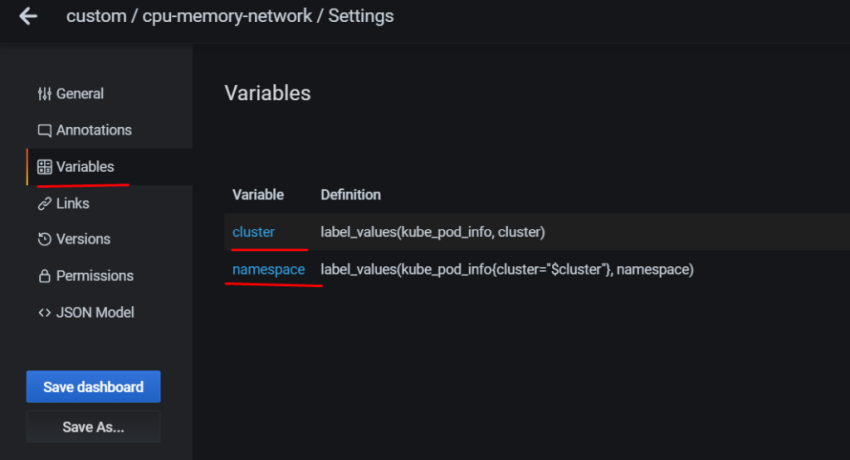
Соответственно – в дашборде хочется выводить статистику и того, и другого. Для этого – добавим переменную, с помощью которой сможем переключаться между ними.
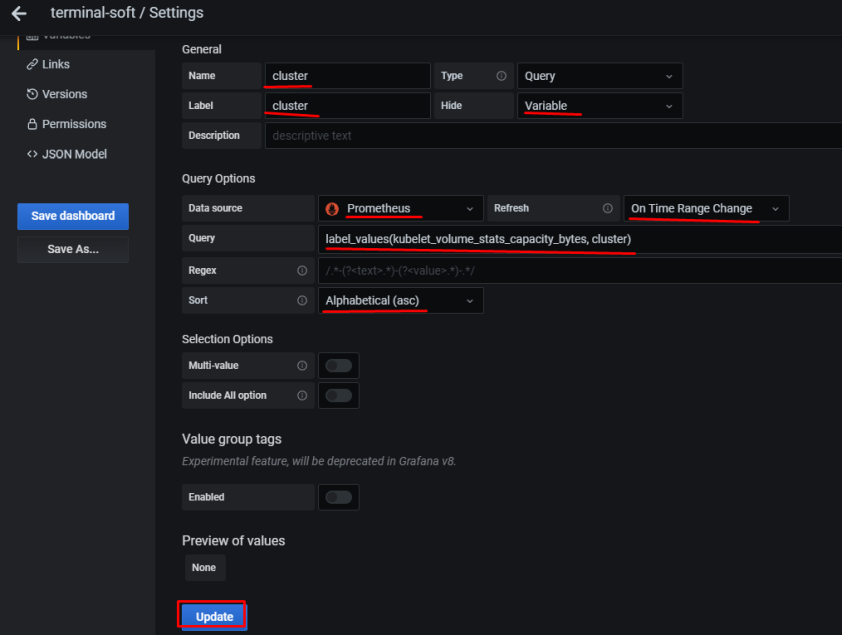
Переходим в Variables:
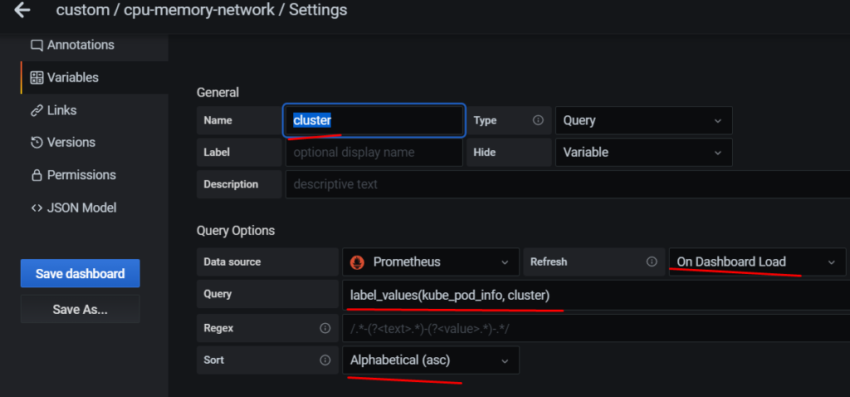
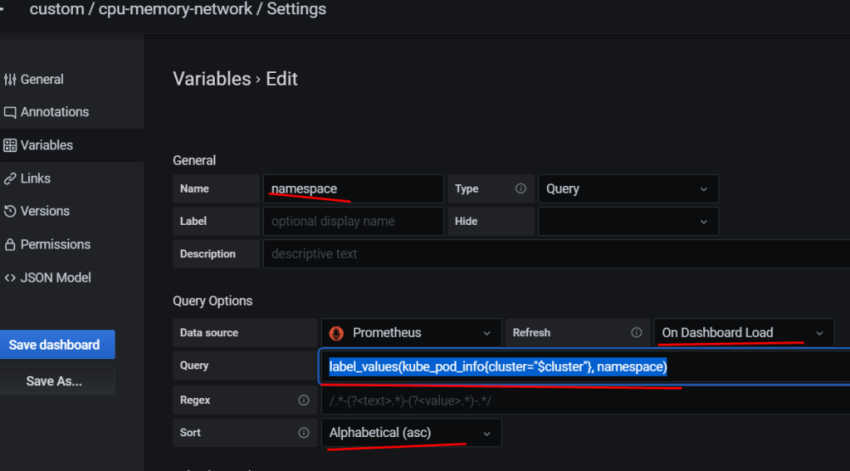
в Name задаём имя, которое будет использоваться в запросах
Type – оставляем Query
Label – имя, как оно будет отображаться в дашборде для выбора
Data source – Prometheus
Refresh – при загрузке дашборда
Query – собственно, сам запрос, который вернёт нам значения, и из которого будем получать список окружений в данном случае Prometheus-сервер, который запущен на EC2, добавляет external_label в виде env=mobilebackend-dev, его и используем для получения значений – используем метрику node_boot_time_seconds, фильтруем вывод по метке job="node-exporter" запрос получается: label_values(node_boot_time_seconds{job="node-exporter"}, env)
Сохраняем – Add внизу.
Статусы хоста
Первым добавим блок, в котором убдут выводить % использования CPU, Load Avareage, память и диски.
CPU Busy
node_cpu_seconds_total
Прежде, чем заниматься настройкой отображения CPU Busy – давайте вспомним /proc/stats.
Сначала – получим время с момента запуска системы:
Выполняем сложение всех счётчиков, делим на 100 – получаем общее кол-во секунд.
Потом, аналогично вычислениям с uptime – получаем кол-во дней, вышло 24 – один день (точнее 4 часа) “потерялся”, но не критично – в целом значения сошлись.
Теперь выведем метрики node_exporter, и сравним их с данными из /proc/stat (на самом деле метрики я вывел немного раньше, поэтому будет разница):
root@bm-backed-app-dev:/opt/prometheus-client# curl -s localhost:9100/metrics | grep node_cpu_seconds_total

HELP node_cpu_seconds_total Seconds the cpus spent in each mode.

TYPE node_cpu_seconds_total counter

node_cpu_seconds_total{cpu="0",mode="idle"} 2.13035164e+06

node_cpu_seconds_total{cpu="0",mode="iowait"} 579.98

node_cpu_seconds_total{cpu="0",mode="irq"} 0

node_cpu_seconds_total{cpu="0",mode="nice"} 11.88

node_cpu_seconds_total{cpu="0",mode="softirq"} 298.71

node_cpu_seconds_total{cpu="0",mode="steal"} 1340.68

node_cpu_seconds_total{cpu="0",mode="system"} 4660.78

node_cpu_seconds_total{cpu="0",mode="user"} 14346.37
И сравниваем с stat:
user: stat = 14351.56, exporter = 14346.37
system: stat = 4662.32, exporter = 4660.78
Окей – тут тоже всё более-менее сходится, и значение данных из node_cpu_seconds_total понятно.
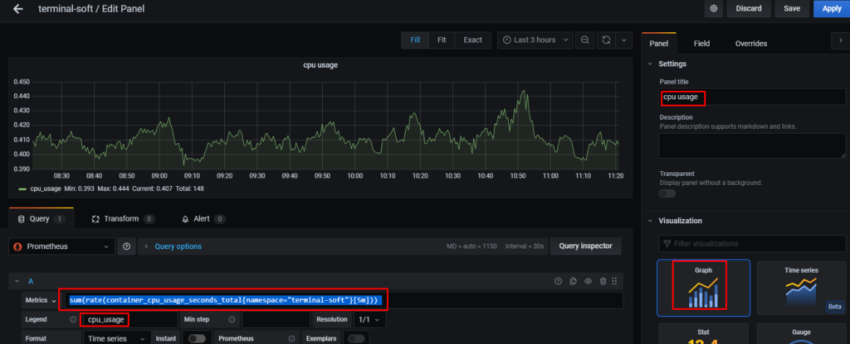
Запрос
Теперь рассмотрим запрос, который будем использовать для получения CPU Busy %:
(((count(count(node_cpu_seconds_total{env="$environment"}) by (cpu))) - avg(sum by (mode)(irate(node_cpu_seconds_total{mode='idle',env="$environment"}[5m])))) * 100) / count(count(node_cpu_seconds_total{env="$environment"}) by (cpu))
Тут:
count – считаем кол-во элементов, полученных из запроса
irate – считает значение в секунду, основываясь на двух последних данных
node_cpu_seconds_total – секунды в каждом режиме (system, user, idle etc)
{env=~"$environment"} – выборка по значению переменной $environment
Подсчёт кол-ва ядер
Кол-во ядер мы получаем запросом ((count(count(node_cpu_seconds_total{env="$environment"}) by (cpu))).
Рассмотрим его детальнее.
Сначала сделаем выборку по node_cpu_seconds_total{env=~"mobilebackend-dev"}:
Так мы получим значения node_cpu_seconds_total по каждому типу – iowait, user, system, nice etc.
В count(node_cpu_seconds_total{env=~"mobilebackend-dev"}) считаем общее кол-во элементов (iowait, user, system, nice etc), хотя оно нам не надо – мы просто используем этот массив для следующего запроса.
А следующий запрос – count(node_cpu_seconds_total{env=~"mobilebackend-dev"}) by (cpu) возвращает нам общее кол-во node_cpu_seconds_total по типам для каждого ядра:
Например для Production это будет выглядеть так:
И в конце-концов добавив ещё один счётчик – count, и превратив запрос в count(count(node_cpu_seconds_total{env=~"mobilebackend-dev"}) by (cpu)) – мы получим кол-во ядер:
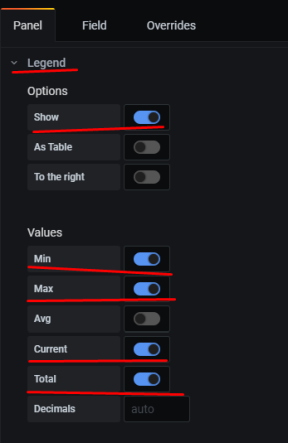
Coloring – включаем красивую подсветку по значениям, и в Thresholds задаём значения, при которых цвет будет меняться – на оранжевый при 75%, и на красный – при 90%
Stat – Current
Unit – выбираем None > percent 1-100
Получается такое:
Возвращаемся к дашборе, добавляем ещё один елемент – Row:
Задаём имя, меняем размер панельки с CPU Busy:
Load Average
Следующая панелька будет выводить Load Average.
Можно было бы вывести просто значение node_load1{env=~"$environment"} – но на Dev сервере одно ядро, и значение node_load1 == 1 будет являться условными 100% для одного ядра, а на Production с его 8 ядрами node_load1 == 1 будет всего:
>>> 1.0 / 8 * 100

12.5
12.5%
Значит, что бы корректно отрисовывать шкалу – нам потребуется получить значение LA, поделить его на кол-во ядер и умножить на 100 – получим % от “максимального” (в кавычках, потому что LA может быть и выше 1 для 1 ядра или 8 для 8 ядер) значения.
Следовательно – используем такой запрос:
avg(node_load1{env=~"$environment"}) / count(count(node_cpu_seconds_total{env=~"$environment"}) by (cpu)) * 100
в (node_memory_MemTotal_bytes{env="$environment"} - node_memory_MemFree_bytes{env="$environment"}) считаем общее кол-во занятой памяти (active + cache), назовём её busy
и считаем busy / total * 100 – получаем % от свободной памяти
В Options включаем шкалу, настраиваем аналогично примерам выше:
Повторяем для второго диска – /rootfs/data, получаем такую картинку в дашборде:
Текущеее время
Следующим – добавим отображение текущего времени. Во-первых – просто удобно на экране (в комнате висит большой телевизор, на котором выводится борда) видеть текущее время, во-вторых – такая себе проверка на то, что браузер/дашборда не зависли, и обновляются.
Для вывода времени – опять используем Singlestat панели, и функцию timestamp(), которой передадим метрику up (можно любую – нам только требуется получить из метрики время).
Добавим ещё несколько графиков – статистику с AWS Application Load Balancer.
Тут надо добавить ещё одну переменную – Load balancer.
К сожалению – cloudformation_exporter не умеет получать теги, поэтому пока придётся использовать просто имена ALB (надо будет посмотреть – может на стороне Prometheus можно будет сделать им relabel).
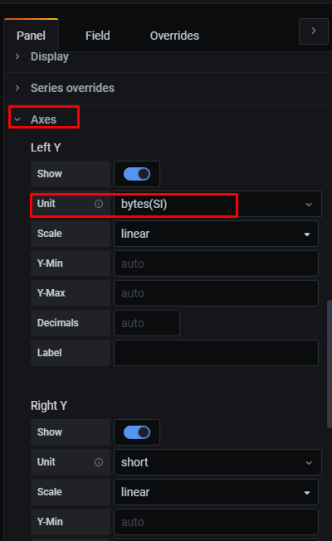
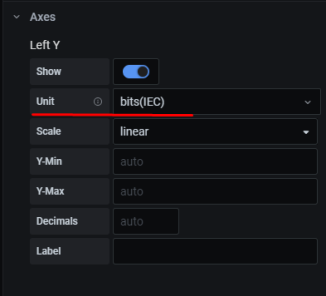
Переходим в Axes, и включаем отображение шкалы Y справа, в юнитах используем милисекунды:
Далее переходим в Display > Series overrides > Add override, и в Alias or regex указываем алиас метрики, в данном случае мы хотим выводить время, основываясь на данных из `aws_applicationelb_target_response_time_sum`, который в метриках указывается как response_time ms:
Кликаем на “+” – добавляем желамое действие. Тут указываем отображание времени в Y Right и заодно – можно поиграть со цветом:
И всё вместе теперь выглядит так:
EC2 statistics
И последним – добавим графики EC2.
В принципе – тут ничего такого, что уже не рассматривалось выше.
CPU
Сначала – статистика использования CPU – System, User, IOwait, idle.
В самом простом виде запросы выглядел бы так:
sum by (instance)(rate(node_cpu_seconds_total{mode="system",env="$environment"}[5m])) * 100
Получаем % от времени, которое CPU проёвл в режиме system/user/idle и т.д.
Но в случае, когда у нас несколько ядер – добавляем вычисление % от кол-ва ядер, аналоигчно тому, как мы это делали для отрисовки шкалы с % LA и CPU Busy:
(avg(sum by (instance)(rate(node_cpu_seconds_total{mode="idle",env="$environment"}[5m])) * 100)) / count(count(node_cpu_seconds_total{env="$environment",instance="localhost:9100"}) by (cpu))
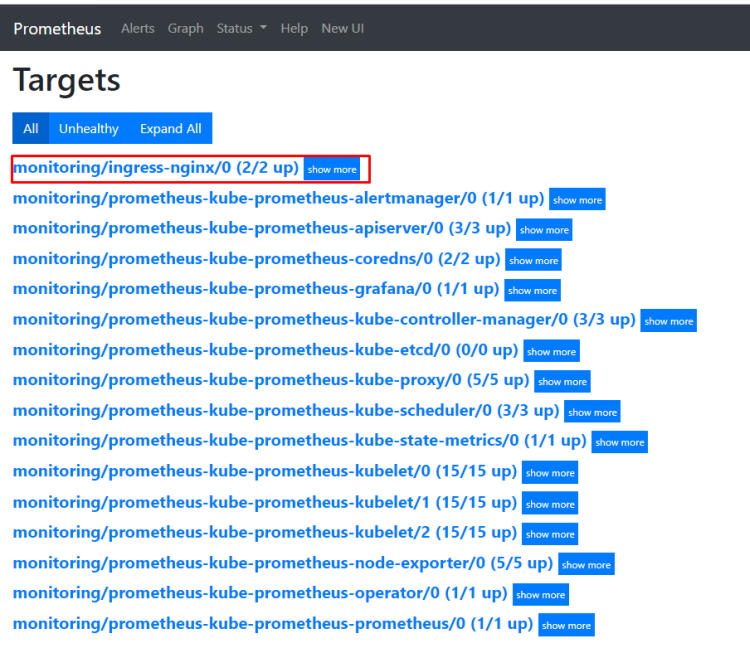
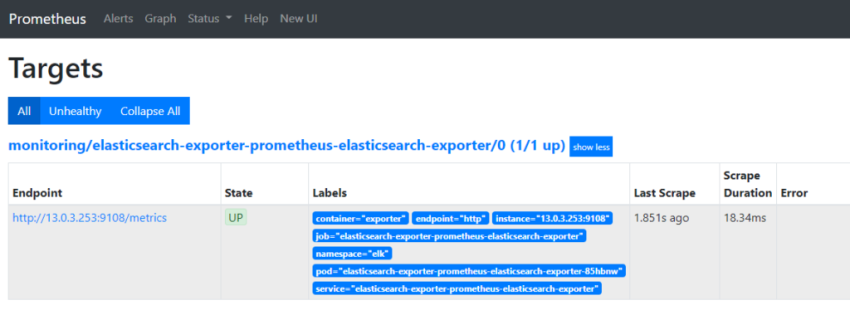
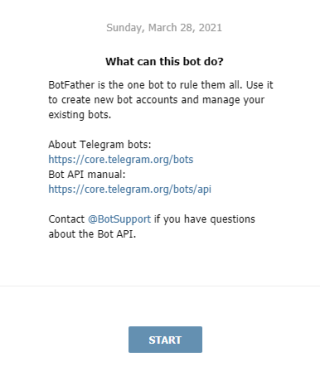
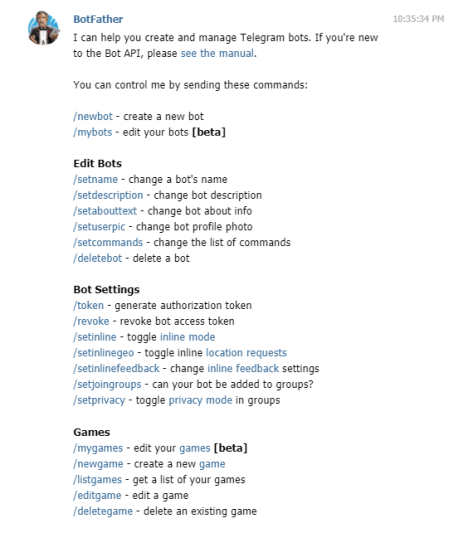
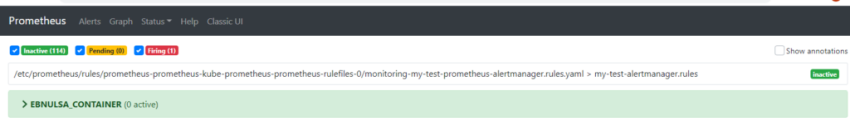
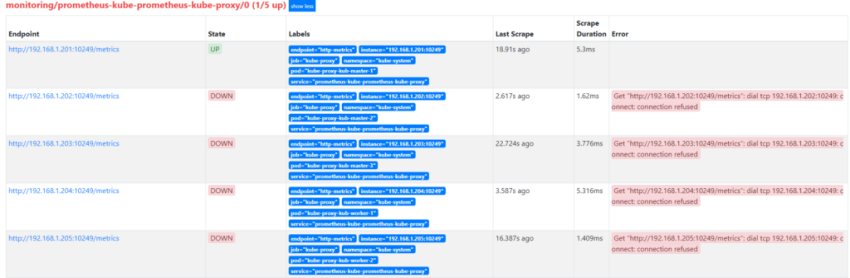
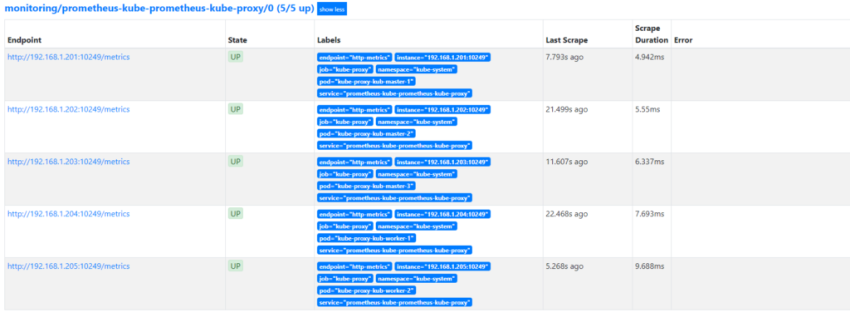
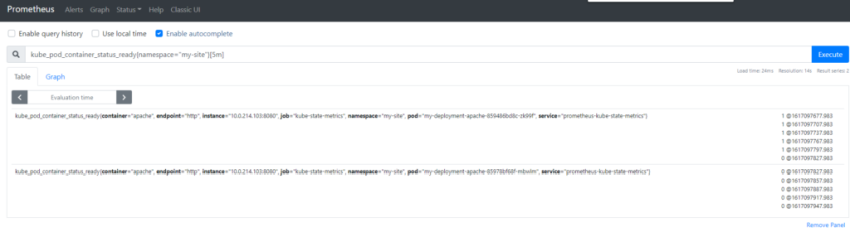
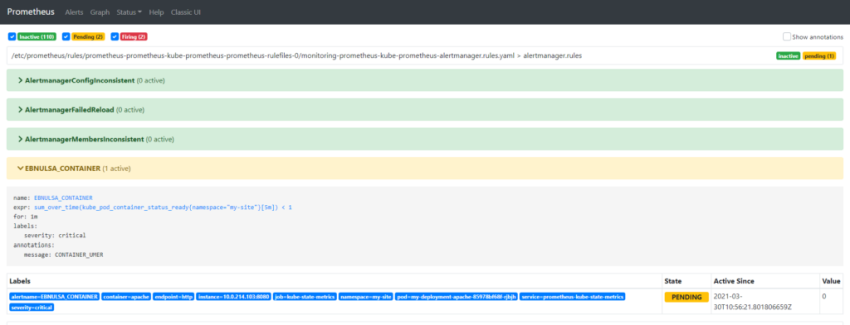
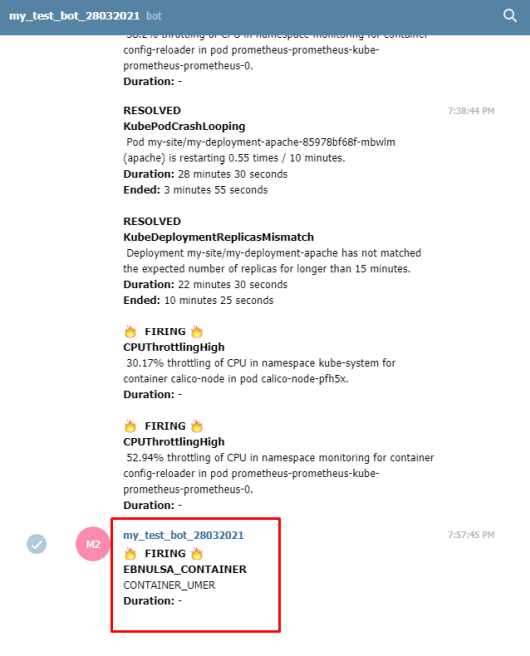
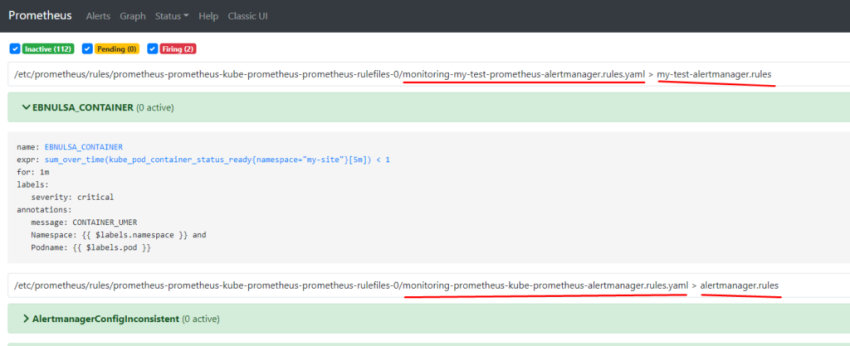
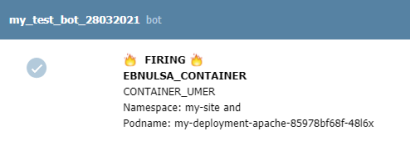
1.Установка prometheus 2.exporter nginx(ingress-controller) 3.exporter elasticsearch 4.exporter rabbitmq 5.exporter redis 6.настройка оповещений в telegram 6.1 настройка оповещений в telegram в различные чаты(группы) 6.2. настройка оповещений в telegram разграничение оповещений по группам (исключения уведомлений) 7.Проблема с prometheus-kube-proxy 8.Настройка алерта для определённого неймспейса 9.Добавление оповещений и по email 10. Настройка графиков в grafana
Качаем репозиторий
git clone https://github.com/prometheus-community/helm-charts.git cd helm-charts/charts/kube-prometheus-stack/ докачиваем чарты: helm dep update
создаём namescpase в котором будет всё крутиться: kubectl create ns monitoring
теперь рассмотрим что правим в переменных у helm chart:
[root@prod-vsrv-kubemaster1 charts]# vim kube-prometheus-stack/values.yaml
тут указываем ingress а также добавляем хранение dashboard в nfs storage-class
grafana:

  enabled: true

  namespaceOverride: "monitoring"

  ## Deploy default dashboards.

  ##

  defaultDashboardsEnabled: true

  adminPassword: prom-operator

  ingress:

    ## If true, Grafana Ingress will be created

    ##

    enabled: true

     labels: {}

    ## Hostnames.

    ## Must be provided if Ingress is enable.

    ##

    hosts:

      - grafana.prod.test.local

    #hosts: []

    ## Path for grafana ingress

    path: /

    ## TLS configuration for grafana Ingress

    ## Secret must be manually created in the namespace

    ##

    tls: []

    # - secretName: grafana-general-tls

    #   hosts:

    #   - grafana.example.com

  persistence:

    type: pvc

    enabled: true

    storageClassName: nfs-storageclass

    accessModes:

      - ReadWriteMany

    size: 5Gi

    # annotations: {}

    finalizers:

      - kubernetes.io/pvc-protection
  ## If using kubeControllerManager.endpoints only the port and targetPort are used

  ##

  service:

    port: 10252

    targetPort: 10252

    selector:

      k8s-app: kube-controller-manager

    #   component: kube-controller-manager
  ## If using kubeScheduler.endpoints only the port and targetPort are used

  ##

  service:

    port: 10251

    targetPort: 10251

    selector:

      k8s-app: kube-scheduler

    #   component: kube-scheduler
## Configuration for prometheus-node-exporter subchart
##
prometheus-node-exporter:
namespaceOverride: "monitoring"
теперь настраиваем ingress для prometheus
ingress:
enabled: true
annotations: {}
labels: {}
## Hostnames.
## Must be provided if Ingress is enabled.
##
hosts:
- prometheus.prod.test.local
## Paths to use for ingress rules -
##
paths:
- /
и теперь важная фишка, добавление label который надо будет добавить на все неймспейсы:
## Namespaces to be selected for ServiceMonitor discovery.
##
serviceMonitorNamespaceSelector:
matchLabels:
prometheus: enabled
## Log level for Alertmanager to be configured with.
##
logLevel: info
## Size is the expected size of the alertmanager cluster. The controller will eventually make the size of the
## running cluster equal to the expected size.
replicas: 3
также правим:
## Enable scraping /metrics/resource from kubelet's service
## This is disabled by default because container metrics are already exposed by cAdvisor
##
resource: true
для выставления срока хранения данных можем поменять следующее значение:
## Time duration Alertmanager shall retain data for. Default is '120h', and must match the regular expression
## [0-9]+(ms|s|m|h) (milliseconds seconds minutes hours).
##
retention: 120h
Release "prometheus" does not exist. Installing it now.
NAME: prometheus
LAST DEPLOYED: Thu Mar 4 13:25:07 2021
NAMESPACE: monitoring
STATUS: deployed
REVISION: 1
NOTES:
kube-prometheus-stack has been installed. Check its status by running:
kubectl --namespace monitoring get pods -l "release=prometheus"
Visit https://github.com/prometheus-operator/kube-prometheus for instructions on how to create & configure Alertmanager and Prometheus instances using the Operator.
видим что при запуске добавился label release=prometheus — проверяем: kubectl describe pod prometheus-kube-prometheus-operator-659d5f8674-qxrf5 -n monitoring | grep -i release release=prometheus
смотрим label на всех неймсмейсах: kubectl get ns —show-labels
NAME STATUS AGE LABELS
default Active 192d <none>
elk Active 63d <none>
ingress-nginx Active 192d name=ingress-nginx
keda Active 86d <none>
kube-node-lease Active 192d <none>
kube-public Active 192d <none>
kube-system Active 192d name=kube-system
m-logstash-megabuilder Active 12d <none>
monitoring Active 3h15m <none>
terminal-soft Active 176d <none>
проставим на них label release=prometheus kubectl label namespace —all «prometheus=enabled»
проверяем: kubectl get ns —show-labels
NAME STATUS AGE LABELS
default Active 192d prometheus=enabled
elk Active 63d prometheus=enabled
ingress-nginx Active 192d name=ingress-nginx,prometheus=enabled
keda Active 86d prometheus=enabled
kube-node-lease Active 192d prometheus=enabled
kube-public Active 192d prometheus=enabled
kube-system Active 192d name=kube-system,prometheus=enabled
m-logstash-megabuilder Active 12d prometheus=enabled
monitoring Active 3h16m prometheus=enabled
terminal-soft Active 176d prometheus=enabled
теперь настроим сбор метрик с ingress controller,
создаём сервис для ingress. Указываем namespace в котором работает ingress, так же необходим label app.kubernetes.io/name: ingress-nginx данный лейб смотрим так: kubectl describe pod -n ingress-nginx ingress-nginx-controller-vqjkl | grep -A3 Labels
## Enable scraping /metrics/resource from kubelet's service
## This is disabled by default because container metrics are already exposed by cAdvisor
##
resource: true
# Default values for kube-prometheus-stack.
# This is a YAML-formatted file.
# Declare variables to be passed into your templates.
## Provide a name in place of kube-prometheus-stack for `app:` labels
##
nameOverride: ""
## Override the deployment namespace
##
namespaceOverride: "monitoring"
## Provide a k8s version to auto dashboard import script example: kubeTargetVersionOverride: 1.16.6
##
kubeTargetVersionOverride: ""
## Provide a name to substitute for the full names of resources
##
fullnameOverride: ""
## Labels to apply to all resources
##
commonLabels: {}
# scmhash: abc123
# myLabel: aakkmd
## Create default rules for monitoring the cluster
##
defaultRules:
create: true
rules:
alertmanager: true
etcd: true
general: true
k8s: true
kubeApiserver: true
kubeApiserverAvailability: true
kubeApiserverError: true
kubeApiserverSlos: true
kubelet: true
kubePrometheusGeneral: true
kubePrometheusNodeAlerting: true
kubePrometheusNodeRecording: true
kubernetesAbsent: true
kubernetesApps: true
kubernetesResources: true
kubernetesStorage: true
kubernetesSystem: true
kubeScheduler: true
kubeStateMetrics: true
network: true
node: true
prometheus: true
prometheusOperator: true
time: true
## Runbook url prefix for default rules
runbookUrl: https://github.com/kubernetes-monitoring/kubernetes-mixin/tree/master/runbook.md#
## Reduce app namespace alert scope
appNamespacesTarget: ".*"
## Labels for default rules
labels: {}
## Annotations for default rules
annotations: {}
## Additional labels for PrometheusRule alerts
additionalRuleLabels: {}
## Deprecated way to provide custom recording or alerting rules to be deployed into the cluster.
##
# additionalPrometheusRules: []
# - name: my-rule-file
# groups:
# - name: my_group
# rules:
# - record: my_record
# expr: 100 * my_record
## Provide custom recording or alerting rules to be deployed into the cluster.
##
additionalPrometheusRulesMap: {}
# rule-name:
# groups:
# - name: my_group
# rules:
# - record: my_record
# expr: 100 * my_record
##
global:
rbac:
create: true
pspEnabled: true
pspAnnotations: {}
## Specify pod annotations
## Ref: https://kubernetes.io/docs/concepts/policy/pod-security-policy/#apparmor
## Ref: https://kubernetes.io/docs/concepts/policy/pod-security-policy/#seccomp
## Ref: https://kubernetes.io/docs/concepts/policy/pod-security-policy/#sysctl
##
# seccomp.security.alpha.kubernetes.io/allowedProfileNames: '*'
# seccomp.security.alpha.kubernetes.io/defaultProfileName: 'docker/default'
# apparmor.security.beta.kubernetes.io/defaultProfileName: 'runtime/default'
## Reference to one or more secrets to be used when pulling images
## ref: https://kubernetes.io/docs/tasks/configure-pod-container/pull-image-private-registry/
##
imagePullSecrets: []
# - name: "image-pull-secret"
## Configuration for alertmanager
## ref: https://prometheus.io/docs/alerting/alertmanager/
##
alertmanager:
## Deploy alertmanager
##
enabled: true
## Api that prometheus will use to communicate with alertmanager. Possible values are v1, v2
##
apiVersion: v2
## Service account for Alertmanager to use.
## ref: https://kubernetes.io/docs/tasks/configure-pod-container/configure-service-account/
##
serviceAccount:
create: true
name: ""
annotations: {}
## Configure pod disruption budgets for Alertmanager
## ref: https://kubernetes.io/docs/tasks/run-application/configure-pdb/#specifying-a-poddisruptionbudget
## This configuration is immutable once created and will require the PDB to be deleted to be changed
## https://github.com/kubernetes/kubernetes/issues/45398
##
podDisruptionBudget:
enabled: false
minAvailable: 1
maxUnavailable: ""
## Alertmanager configuration directives
## ref: https://prometheus.io/docs/alerting/configuration/#configuration-file
## https://prometheus.io/webtools/alerting/routing-tree-editor/
##
config:
global:
resolve_timeout: 5m
route:
receiver: 'telegram'
routes:
- match:
severity: critical
repeat_interval: 48h
continue: true
receiver: 'telegram'
- match:
alertname: Watchdog
repeat_interval: 48h
continue: true
receiver: 'telegram'
receivers:
- name: 'telegram'
webhook_configs:
- send_resolved: true
url: 'http://alertmanager-bot:8080'
# config:
# global:
# resolve_timeout: 5m
# route:
# group_by: ['job']
# group_wait: 30s
# group_interval: 5m
# repeat_interval: 12h
# receiver: 'null'
# routes:
# - match:
# alertname: Watchdog
# receiver: 'null'
# receivers:
# - name: 'null'
templates:
- '/etc/alertmanager/config/*.tmpl'
## Pass the Alertmanager configuration directives through Helm's templating
## engine. If the Alertmanager configuration contains Alertmanager templates,
## they'll need to be properly escaped so that they are not interpreted by
## Helm
## ref: https://helm.sh/docs/developing_charts/#using-the-tpl-function
## https://prometheus.io/docs/alerting/configuration/#tmpl_string
## https://prometheus.io/docs/alerting/notifications/
## https://prometheus.io/docs/alerting/notification_examples/
tplConfig: false
## Alertmanager template files to format alerts
## By default, templateFiles are placed in /etc/alertmanager/config/ and if
## they have a .tmpl file suffix will be loaded. See config.templates above
## to change, add other suffixes. If adding other suffixes, be sure to update
## config.templates above to include those suffixes.
## ref: https://prometheus.io/docs/alerting/notifications/
## https://prometheus.io/docs/alerting/notification_examples/
##
templateFiles: {}
#
## An example template:
# template_1.tmpl: |-
# {{ define "cluster" }}{{ .ExternalURL | reReplaceAll ".*alertmanager\.(.*)" "$1" }}{{ end }}
#
# {{ define "slack.myorg.text" }}
# {{- $root := . -}}
# {{ range .Alerts }}
# *Alert:* {{ .Annotations.summary }} - `{{ .Labels.severity }}`
# *Cluster:* {{ template "cluster" $root }}
# *Description:* {{ .Annotations.description }}
# *Graph:* <{{ .GeneratorURL }}|:chart_with_upwards_trend:>
# *Runbook:* <{{ .Annotations.runbook }}|:spiral_note_pad:>
# *Details:*
# {{ range .Labels.SortedPairs }} • *{{ .Name }}:* `{{ .Value }}`
# {{ end }}
# {{ end }}
# {{ end }}
ingress:
enabled: true
# For Kubernetes >= 1.18 you should specify the ingress-controller via the field ingressClassName
# See https://kubernetes.io/blog/2020/04/02/improvements-to-the-ingress-api-in-kubernetes-1.18/#specifying-the-class-of-an-ingress
# ingressClassName: nginx
annotations: {}
labels: {}
## Hosts must be provided if Ingress is enabled.
##
hosts:
- alertmanager.prod.test.local
## Paths to use for ingress rules - one path should match the alertmanagerSpec.routePrefix
##
paths:
- /
## For Kubernetes >= 1.18 you should specify the pathType (determines how Ingress paths should be matched)
## See https://kubernetes.io/blog/2020/04/02/improvements-to-the-ingress-api-in-kubernetes-1.18/#better-path-matching-with-path-types
# pathType: ImplementationSpecific
## TLS configuration for Alertmanager Ingress
## Secret must be manually created in the namespace
##
tls: []
# - secretName: alertmanager-general-tls
# hosts:
# - alertmanager.example.com
## Configuration for Alertmanager secret
##
secret:
annotations: {}
## Configuration for creating an Ingress that will map to each Alertmanager replica service
## alertmanager.servicePerReplica must be enabled
##
ingressPerReplica:
enabled: false
# For Kubernetes >= 1.18 you should specify the ingress-controller via the field ingressClassName
# See https://kubernetes.io/blog/2020/04/02/improvements-to-the-ingress-api-in-kubernetes-1.18/#specifying-the-class-of-an-ingress
# ingressClassName: nginx
annotations: {}
labels: {}
## Final form of the hostname for each per replica ingress is
## {{ ingressPerReplica.hostPrefix }}-{{ $replicaNumber }}.{{ ingressPerReplica.hostDomain }}
##
## Prefix for the per replica ingress that will have `-$replicaNumber`
## appended to the end
hostPrefix: ""
## Domain that will be used for the per replica ingress
hostDomain: ""
## Paths to use for ingress rules
##
paths: []
# - /
## For Kubernetes >= 1.18 you should specify the pathType (determines how Ingress paths should be matched)
## See https://kubernetes.io/blog/2020/04/02/improvements-to-the-ingress-api-in-kubernetes-1.18/#better-path-matching-with-path-types
# pathType: ImplementationSpecific
## Secret name containing the TLS certificate for alertmanager per replica ingress
## Secret must be manually created in the namespace
tlsSecretName: ""
## Separated secret for each per replica Ingress. Can be used together with cert-manager
##
tlsSecretPerReplica:
enabled: false
## Final form of the secret for each per replica ingress is
## {{ tlsSecretPerReplica.prefix }}-{{ $replicaNumber }}
##
prefix: "alertmanager"
## Configuration for Alertmanager service
##
service:
annotations: {}
labels: {}
clusterIP: ""
## Port for Alertmanager Service to listen on
##
port: 9093
## To be used with a proxy extraContainer port
##
targetPort: 9093
## Port to expose on each node
## Only used if service.type is 'NodePort'
##
nodePort: 30903
## List of IP addresses at which the Prometheus server service is available
## Ref: https://kubernetes.io/docs/user-guide/services/#external-ips
##
## Additional ports to open for Alertmanager service
additionalPorts: []
externalIPs: []
loadBalancerIP: ""
loadBalancerSourceRanges: []
## Service type
##
type: ClusterIP
## Configuration for creating a separate Service for each statefulset Alertmanager replica
##
servicePerReplica:
enabled: false
annotations: {}
## Port for Alertmanager Service per replica to listen on
##
port: 9093
## To be used with a proxy extraContainer port
targetPort: 9093
## Port to expose on each node
## Only used if servicePerReplica.type is 'NodePort'
##
nodePort: 30904
## Loadbalancer source IP ranges
## Only used if servicePerReplica.type is "loadbalancer"
loadBalancerSourceRanges: []
## Service type
##
type: ClusterIP
## If true, create a serviceMonitor for alertmanager
##
serviceMonitor:
## Scrape interval. If not set, the Prometheus default scrape interval is used.
##
interval: ""
selfMonitor: true
## scheme: HTTP scheme to use for scraping. Can be used with `tlsConfig` for example if using istio mTLS.
scheme: ""
## tlsConfig: TLS configuration to use when scraping the endpoint. For example if using istio mTLS.
## Of type: https://github.com/coreos/prometheus-operator/blob/master/Documentation/api.md#tlsconfig
tlsConfig: {}
bearerTokenFile:
## metric relabel configs to apply to samples before ingestion.
##
metricRelabelings: []
# - action: keep
# regex: 'kube_(daemonset|deployment|pod|namespace|node|statefulset).+'
# sourceLabels: [__name__]
# relabel configs to apply to samples before ingestion.
##
relabelings: []
# - sourceLabels: [__meta_kubernetes_pod_node_name]
# separator: ;
# regex: ^(.*)$
# targetLabel: nodename
# replacement: $1
# action: replace
## Settings affecting alertmanagerSpec
## ref: https://github.com/prometheus-operator/prometheus-operator/blob/master/Documentation/api.md#alertmanagerspec
##
alertmanagerSpec:
## Standard object’s metadata. More info: https://github.com/kubernetes/community/blob/master/contributors/devel/sig-architecture/api-conventions.md#metadata
## Metadata Labels and Annotations gets propagated to the Alertmanager pods.
##
podMetadata: {}
## Image of Alertmanager
##
image:
repository: quay.io/prometheus/alertmanager
tag: v0.21.0
sha: ""
## If true then the user will be responsible to provide a secret with alertmanager configuration
## So when true the config part will be ignored (including templateFiles) and the one in the secret will be used
##
useExistingSecret: false
## Secrets is a list of Secrets in the same namespace as the Alertmanager object, which shall be mounted into the
## Alertmanager Pods. The Secrets are mounted into /etc/alertmanager/secrets/.
##
secrets: []
## ConfigMaps is a list of ConfigMaps in the same namespace as the Alertmanager object, which shall be mounted into the Alertmanager Pods.
## The ConfigMaps are mounted into /etc/alertmanager/configmaps/.
##
configMaps: []
## ConfigSecret is the name of a Kubernetes Secret in the same namespace as the Alertmanager object, which contains configuration for
## this Alertmanager instance. Defaults to 'alertmanager-' The secret is mounted into /etc/alertmanager/config.
##
# configSecret:
## AlertmanagerConfigs to be selected to merge and configure Alertmanager with.
##
alertmanagerConfigSelector: {}
## Example which selects all alertmanagerConfig resources
## with label "alertconfig" with values any of "example-config" or "example-config-2"
# alertmanagerConfigSelector:
# matchExpressions:
# - key: alertconfig
# operator: In
# values:
# - example-config
# - example-config-2
#
## Example which selects all alertmanagerConfig resources with label "role" set to "example-config"
# alertmanagerConfigSelector:
# matchLabels:
# role: example-config
## Namespaces to be selected for AlertmanagerConfig discovery. If nil, only check own namespace.
##
alertmanagerConfigNamespaceSelector: {}
## Example which selects all namespaces
## with label "alertmanagerconfig" with values any of "example-namespace" or "example-namespace-2"
# alertmanagerConfigNamespaceSelector:
# matchExpressions:
# - key: alertmanagerconfig
# operator: In
# values:
# - example-namespace
# - example-namespace-2
## Example which selects all namespaces with label "alertmanagerconfig" set to "enabled"
# alertmanagerConfigNamespaceSelector:
# matchLabels:
# alertmanagerconfig: enabled
## Define Log Format
# Use logfmt (default) or json logging
logFormat: logfmt
## Log level for Alertmanager to be configured with.
##
logLevel: info
## Size is the expected size of the alertmanager cluster. The controller will eventually make the size of the
## running cluster equal to the expected size.
replicas: 3
## Time duration Alertmanager shall retain data for. Default is '120h', and must match the regular expression
## [0-9]+(ms|s|m|h) (milliseconds seconds minutes hours).
##
retention: 120h
## Storage is the definition of how storage will be used by the Alertmanager instances.
## ref: https://github.com/prometheus-operator/prometheus-operator/blob/master/Documentation/user-guides/storage.md
##
storage:
volumeClaimTemplate:
spec:
storageClassName: nfs-storageclass
accessModes: ["ReadWriteMany"]
resources:
requests:
storage: 10Gi
# selector: {}
## The external URL the Alertmanager instances will be available under. This is necessary to generate correct URLs. This is necessary if Alertmanager is not served from root of a DNS name. string false
##
externalUrl:
## The route prefix Alertmanager registers HTTP handlers for. This is useful, if using ExternalURL and a proxy is rewriting HTTP routes of a request, and the actual ExternalURL is still true,
## but the server serves requests under a different route prefix. For example for use with kubectl proxy.
##
routePrefix: /
## If set to true all actions on the underlying managed objects are not going to be performed, except for delete actions.
##
paused: false
## Define which Nodes the Pods are scheduled on.
## ref: https://kubernetes.io/docs/user-guide/node-selection/
##
nodeSelector: {}
## Define resources requests and limits for single Pods.
## ref: https://kubernetes.io/docs/user-guide/compute-resources/
##
resources: {}
# requests:
# memory: 400Mi
## Pod anti-affinity can prevent the scheduler from placing Prometheus replicas on the same node.
## The default value "soft" means that the scheduler should *prefer* to not schedule two replica pods onto the same node but no guarantee is provided.
## The value "hard" means that the scheduler is *required* to not schedule two replica pods onto the same node.
## The value "" will disable pod anti-affinity so that no anti-affinity rules will be configured.
##
podAntiAffinity: ""
## If anti-affinity is enabled sets the topologyKey to use for anti-affinity.
## This can be changed to, for example, failure-domain.beta.kubernetes.io/zone
##
podAntiAffinityTopologyKey: kubernetes.io/hostname
## Assign custom affinity rules to the alertmanager instance
## ref: https://kubernetes.io/docs/concepts/configuration/assign-pod-node/
##
affinity: {}
# nodeAffinity:
# requiredDuringSchedulingIgnoredDuringExecution:
# nodeSelectorTerms:
# - matchExpressions:
# - key: kubernetes.io/e2e-az-name
# operator: In
# values:
# - e2e-az1
# - e2e-az2
## If specified, the pod's tolerations.
## ref: https://kubernetes.io/docs/concepts/configuration/taint-and-toleration/
##
tolerations: []
# - key: "key"
# operator: "Equal"
# value: "value"
# effect: "NoSchedule"
## If specified, the pod's topology spread constraints.
## ref: https://kubernetes.io/docs/concepts/workloads/pods/pod-topology-spread-constraints/
##
topologySpreadConstraints: []
# - maxSkew: 1
# topologyKey: topology.kubernetes.io/zone
# whenUnsatisfiable: DoNotSchedule
# labelSelector:
# matchLabels:
# app: alertmanager
## SecurityContext holds pod-level security attributes and common container settings.
## This defaults to non root user with uid 1000 and gid 2000. *v1.PodSecurityContext false
## ref: https://kubernetes.io/docs/tasks/configure-pod-container/security-context/
##
securityContext:
runAsGroup: 2000
runAsNonRoot: true
runAsUser: 1000
fsGroup: 2000
## ListenLocal makes the Alertmanager server listen on loopback, so that it does not bind against the Pod IP.
## Note this is only for the Alertmanager UI, not the gossip communication.
##
listenLocal: false
## Containers allows injecting additional containers. This is meant to allow adding an authentication proxy to an Alertmanager pod.
##
containers: []
# Additional volumes on the output StatefulSet definition.
volumes: []
# Additional VolumeMounts on the output StatefulSet definition.
volumeMounts: []
## InitContainers allows injecting additional initContainers. This is meant to allow doing some changes
## (permissions, dir tree) on mounted volumes before starting prometheus
initContainers: []
## Priority class assigned to the Pods
##
priorityClassName: ""
## AdditionalPeers allows injecting a set of additional Alertmanagers to peer with to form a highly available cluster.
##
additionalPeers: []
## PortName to use for Alert Manager.
##
portName: "web"
## ClusterAdvertiseAddress is the explicit address to advertise in cluster. Needs to be provided for non RFC1918 [1] (public) addresses. [1] RFC1918: https://tools.ietf.org/html/rfc1918
##
clusterAdvertiseAddress: false
## ForceEnableClusterMode ensures Alertmanager does not deactivate the cluster mode when running with a single replica.
## Use case is e.g. spanning an Alertmanager cluster across Kubernetes clusters with a single replica in each.
forceEnableClusterMode: false
## Using default values from https://github.com/grafana/helm-charts/blob/main/charts/grafana/values.yaml
##
grafana:
enabled: true
namespaceOverride: "monitoring"
## Deploy default dashboards.
##
defaultDashboardsEnabled: true
adminPassword: prom-operator
ingress:
## If true, Grafana Ingress will be created
##
enabled: true
## Annotations for Grafana Ingress
##
annotations: {}
# kubernetes.io/ingress.class: nginx
# kubernetes.io/tls-acme: "true"
## Labels to be added to the Ingress
##
labels: {}
## Hostnames.
## Must be provided if Ingress is enable.
##
hosts:
- grafana.prod.test.local
#hosts: []
## Path for grafana ingress
path: /
## TLS configuration for grafana Ingress
## Secret must be manually created in the namespace
##
tls: []
# - secretName: grafana-general-tls
# hosts:
# - grafana.example.com
sidecar:
dashboards:
enabled: true
label: grafana_dashboard
## Annotations for Grafana dashboard configmaps
##
annotations: {}
multicluster: false
datasources:
enabled: true
defaultDatasourceEnabled: true
# If not defined, will use prometheus.prometheusSpec.scrapeInterval or its default
# defaultDatasourceScrapeInterval: 15s
## Annotations for Grafana datasource configmaps
##
annotations: {}
## Create datasource for each Pod of Prometheus StatefulSet;
## this uses headless service `prometheus-operated` which is
## created by Prometheus Operator
## ref: https://git.io/fjaBS
createPrometheusReplicasDatasources: false
label: grafana_datasource
extraConfigmapMounts: []
# - name: certs-configmap
# mountPath: /etc/grafana/ssl/
# configMap: certs-configmap
# readOnly: true
## Configure additional grafana datasources (passed through tpl)
## ref: http://docs.grafana.org/administration/provisioning/#datasources
additionalDataSources: []
# - name: prometheus-sample
# access: proxy
# basicAuth: true
# basicAuthPassword: pass
# basicAuthUser: daco
# editable: false
# jsonData:
# tlsSkipVerify: true
# orgId: 1
# type: prometheus
# url: https://{{ printf "%s-prometheus.svc" .Release.Name }}:9090
# version: 1
## Passed to grafana subchart and used by servicemonitor below
##
service:
portName: service
## If true, create a serviceMonitor for grafana
##
serviceMonitor:
## Scrape interval. If not set, the Prometheus default scrape interval is used.
##
interval: ""
selfMonitor: true
# Path to use for scraping metrics. Might be different if server.root_url is set
# in grafana.ini
path: "/metrics"
## metric relabel configs to apply to samples before ingestion.
##
metricRelabelings: []
# - action: keep
# regex: 'kube_(daemonset|deployment|pod|namespace|node|statefulset).+'
# sourceLabels: [__name__]
# relabel configs to apply to samples before ingestion.
##
relabelings: []
# - sourceLabels: [__meta_kubernetes_pod_node_name]
# separator: ;
# regex: ^(.*)$
# targetLabel: nodename
# replacement: $1
# action: replace
## Component scraping the kube api server
##
kubeApiServer:
enabled: true
tlsConfig:
serverName: kubernetes
insecureSkipVerify: false
## If your API endpoint address is not reachable (as in AKS) you can replace it with the kubernetes service
##
relabelings: []
# - sourceLabels:
# - __meta_kubernetes_namespace
# - __meta_kubernetes_service_name
# - __meta_kubernetes_endpoint_port_name
# action: keep
# regex: default;kubernetes;https
# - targetLabel: __address__
# replacement: kubernetes.default.svc:443
serviceMonitor:
## Scrape interval. If not set, the Prometheus default scrape interval is used.
##
interval: ""
jobLabel: component
selector:
matchLabels:
component: apiserver
provider: kubernetes
## metric relabel configs to apply to samples before ingestion.
##
metricRelabelings: []
# - action: keep
# regex: 'kube_(daemonset|deployment|pod|namespace|node|statefulset).+'
# sourceLabels: [__name__]
## Component scraping the kubelet and kubelet-hosted cAdvisor
##
kubelet:
enabled: true
namespace: kube-system
serviceMonitor:
## Scrape interval. If not set, the Prometheus default scrape interval is used.
##
interval: ""
## Enable scraping the kubelet over https. For requirements to enable this see
## https://github.com/prometheus-operator/prometheus-operator/issues/926
##
https: true
## Enable scraping /metrics/cadvisor from kubelet's service
##
cAdvisor: true
## Enable scraping /metrics/probes from kubelet's service
##
probes: true
## Enable scraping /metrics/resource from kubelet's service
## This is disabled by default because container metrics are already exposed by cAdvisor
##
resource: true
# From kubernetes 1.18, /metrics/resource/v1alpha1 renamed to /metrics/resource
resourcePath: "/metrics/resource/v1alpha1"
## Metric relabellings to apply to samples before ingestion
##
cAdvisorMetricRelabelings: []
# - sourceLabels: [__name__, image]
# separator: ;
# regex: container_([a-z_]+);
# replacement: $1
# action: drop
# - sourceLabels: [__name__]
# separator: ;
# regex: container_(network_tcp_usage_total|network_udp_usage_total|tasks_state|cpu_load_average_10s)
# replacement: $1
# action: drop
## Metric relabellings to apply to samples before ingestion
##
probesMetricRelabelings: []
# - sourceLabels: [__name__, image]
# separator: ;
# regex: container_([a-z_]+);
# replacement: $1
# action: drop
# - sourceLabels: [__name__]
# separator: ;
# regex: container_(network_tcp_usage_total|network_udp_usage_total|tasks_state|cpu_load_average_10s)
# replacement: $1
# action: drop
# relabel configs to apply to samples before ingestion.
# metrics_path is required to match upstream rules and charts
##
cAdvisorRelabelings:
- sourceLabels: [__metrics_path__]
targetLabel: metrics_path
# - sourceLabels: [__meta_kubernetes_pod_node_name]
# separator: ;
# regex: ^(.*)$
# targetLabel: nodename
# replacement: $1
# action: replace
probesRelabelings:
- sourceLabels: [__metrics_path__]
targetLabel: metrics_path
# - sourceLabels: [__meta_kubernetes_pod_node_name]
# separator: ;
# regex: ^(.*)$
# targetLabel: nodename
# replacement: $1
# action: replace
resourceRelabelings:
- sourceLabels: [__metrics_path__]
targetLabel: metrics_path
# - sourceLabels: [__meta_kubernetes_pod_node_name]
# separator: ;
# regex: ^(.*)$
# targetLabel: nodename
# replacement: $1
# action: replace
metricRelabelings: []
# - sourceLabels: [__name__, image]
# separator: ;
# regex: container_([a-z_]+);
# replacement: $1
# action: drop
# - sourceLabels: [__name__]
# separator: ;
# regex: container_(network_tcp_usage_total|network_udp_usage_total|tasks_state|cpu_load_average_10s)
# replacement: $1
# action: drop
# relabel configs to apply to samples before ingestion.
# metrics_path is required to match upstream rules and charts
##
relabelings:
- sourceLabels: [__metrics_path__]
targetLabel: metrics_path
# - sourceLabels: [__meta_kubernetes_pod_node_name]
# separator: ;
# regex: ^(.*)$
# targetLabel: nodename
# replacement: $1
# action: replace
## Component scraping the kube controller manager
##
kubeControllerManager:
enabled: true
## If your kube controller manager is not deployed as a pod, specify IPs it can be found on
##
endpoints: []
# - 10.141.4.22
# - 10.141.4.23
# - 10.141.4.24
## If using kubeControllerManager.endpoints only the port and targetPort are used
##
service:
port: 10252
targetPort: 10252
selector:
k8s-app: kube-controller-manager
# component: kube-controller-manager
serviceMonitor:
## Scrape interval. If not set, the Prometheus default scrape interval is used.
##
interval: ""
## Enable scraping kube-controller-manager over https.
## Requires proper certs (not self-signed) and delegated authentication/authorization checks
##
https: false
# Skip TLS certificate validation when scraping
insecureSkipVerify: null
# Name of the server to use when validating TLS certificate
serverName: null
## metric relabel configs to apply to samples before ingestion.
##
metricRelabelings: []
# - action: keep
# regex: 'kube_(daemonset|deployment|pod|namespace|node|statefulset).+'
# sourceLabels: [__name__]
# relabel configs to apply to samples before ingestion.
##
relabelings: []
# - sourceLabels: [__meta_kubernetes_pod_node_name]
# separator: ;
# regex: ^(.*)$
# targetLabel: nodename
# replacement: $1
# action: replace
## Component scraping coreDns. Use either this or kubeDns
##
coreDns:
enabled: true
service:
port: 9153
targetPort: 9153
# selector:
# k8s-app: kube-dns
serviceMonitor:
## Scrape interval. If not set, the Prometheus default scrape interval is used.
##
interval: ""
## metric relabel configs to apply to samples before ingestion.
##
metricRelabelings: []
# - action: keep
# regex: 'kube_(daemonset|deployment|pod|namespace|node|statefulset).+'
# sourceLabels: [__name__]
# relabel configs to apply to samples before ingestion.
##
relabelings: []
# - sourceLabels: [__meta_kubernetes_pod_node_name]
# separator: ;
# regex: ^(.*)$
# targetLabel: nodename
# replacement: $1
# action: replace
## Component scraping kubeDns. Use either this or coreDns
##
kubeDns:
enabled: false
service:
dnsmasq:
port: 10054
targetPort: 10054
skydns:
port: 10055
targetPort: 10055
# selector:
# k8s-app: kube-dns
serviceMonitor:
## Scrape interval. If not set, the Prometheus default scrape interval is used.
##
interval: ""
## metric relabel configs to apply to samples before ingestion.
##
metricRelabelings: []
# - action: keep
# regex: 'kube_(daemonset|deployment|pod|namespace|node|statefulset).+'
# sourceLabels: [__name__]
# relabel configs to apply to samples before ingestion.
##
relabelings: []
# - sourceLabels: [__meta_kubernetes_pod_node_name]
# separator: ;
# regex: ^(.*)$
# targetLabel: nodename
# replacement: $1
# action: replace
dnsmasqMetricRelabelings: []
# - action: keep
# regex: 'kube_(daemonset|deployment|pod|namespace|node|statefulset).+'
# sourceLabels: [__name__]
# relabel configs to apply to samples before ingestion.
##
dnsmasqRelabelings: []
# - sourceLabels: [__meta_kubernetes_pod_node_name]
# separator: ;
# regex: ^(.*)$
# targetLabel: nodename
# replacement: $1
# action: replace
## Component scraping etcd
##
kubeEtcd:
enabled: true
## If your etcd is not deployed as a pod, specify IPs it can be found on
##
endpoints: []
# - 10.141.4.22
# - 10.141.4.23
# - 10.141.4.24
## Etcd service. If using kubeEtcd.endpoints only the port and targetPort are used
##
service:
port: 2379
targetPort: 2379
# selector:
# component: etcd
## Configure secure access to the etcd cluster by loading a secret into prometheus and
## specifying security configuration below. For example, with a secret named etcd-client-cert
##
## serviceMonitor:
## scheme: https
## insecureSkipVerify: false
## serverName: localhost
## caFile: /etc/prometheus/secrets/etcd-client-cert/etcd-ca
## certFile: /etc/prometheus/secrets/etcd-client-cert/etcd-client
## keyFile: /etc/prometheus/secrets/etcd-client-cert/etcd-client-key
##
serviceMonitor:
## Scrape interval. If not set, the Prometheus default scrape interval is used.
##
interval: ""
scheme: http
insecureSkipVerify: false
serverName: ""
caFile: ""
certFile: ""
keyFile: ""
## metric relabel configs to apply to samples before ingestion.
##
metricRelabelings: []
# - action: keep
# regex: 'kube_(daemonset|deployment|pod|namespace|node|statefulset).+'
# sourceLabels: [__name__]
# relabel configs to apply to samples before ingestion.
##
relabelings: []
# - sourceLabels: [__meta_kubernetes_pod_node_name]
# separator: ;
# regex: ^(.*)$
# targetLabel: nodename
# replacement: $1
# action: replace
## Component scraping kube scheduler
##
kubeScheduler:
enabled: true
## If your kube scheduler is not deployed as a pod, specify IPs it can be found on
##
endpoints: []
# - 10.141.4.22
# - 10.141.4.23
# - 10.141.4.24
## If using kubeScheduler.endpoints only the port and targetPort are used
##
service:
port: 10251
targetPort: 10251
selector:
k8s-app: kube-scheduler
# component: kube-scheduler
serviceMonitor:
## Scrape interval. If not set, the Prometheus default scrape interval is used.
##
interval: ""
## Enable scraping kube-scheduler over https.
## Requires proper certs (not self-signed) and delegated authentication/authorization checks
##
https: false
## Skip TLS certificate validation when scraping
insecureSkipVerify: null
## Name of the server to use when validating TLS certificate
serverName: null
## metric relabel configs to apply to samples before ingestion.
##
metricRelabelings: []
# - action: keep
# regex: 'kube_(daemonset|deployment|pod|namespace|node|statefulset).+'
# sourceLabels: [__name__]
# relabel configs to apply to samples before ingestion.
##
relabelings: []
# - sourceLabels: [__meta_kubernetes_pod_node_name]
# separator: ;
# regex: ^(.*)$
# targetLabel: nodename
# replacement: $1
# action: replace
## Component scraping kube proxy
##
kubeProxy:
enabled: true
## If your kube proxy is not deployed as a pod, specify IPs it can be found on
##
endpoints: []
# - 10.141.4.22
# - 10.141.4.23
# - 10.141.4.24
service:
port: 10249
targetPort: 10249
# selector:
# k8s-app: kube-proxy
serviceMonitor:
## Scrape interval. If not set, the Prometheus default scrape interval is used.
##
interval: ""
## Enable scraping kube-proxy over https.
## Requires proper certs (not self-signed) and delegated authentication/authorization checks
##
https: false
## metric relabel configs to apply to samples before ingestion.
##
metricRelabelings: []
# - action: keep
# regex: 'kube_(daemonset|deployment|pod|namespace|node|statefulset).+'
# sourceLabels: [__name__]
# relabel configs to apply to samples before ingestion.
##
relabelings: []
# - action: keep
# regex: 'kube_(daemonset|deployment|pod|namespace|node|statefulset).+'
# sourceLabels: [__name__]
## Component scraping kube state metrics
##
kubeStateMetrics:
enabled: true
serviceMonitor:
## Scrape interval. If not set, the Prometheus default scrape interval is used.
##
interval: ""
## Override serviceMonitor selector
##
selectorOverride: {}
## metric relabel configs to apply to samples before ingestion.
##
metricRelabelings: []
# - action: keep
# regex: 'kube_(daemonset|deployment|pod|namespace|node|statefulset).+'
# sourceLabels: [__name__]
# relabel configs to apply to samples before ingestion.
##
relabelings: []
# - sourceLabels: [__meta_kubernetes_pod_node_name]
# separator: ;
# regex: ^(.*)$
# targetLabel: nodename
# replacement: $1
# action: replace
## Configuration for kube-state-metrics subchart

##

kube-state-metrics:

  namespaceOverride: "monitoring"

  rbac:

    create: true

  podSecurityPolicy:

    enabled: true
## Deploy node exporter as a daemonset to all nodes
##
nodeExporter:
enabled: true
## Use the value configured in prometheus-node-exporter.podLabels
##
jobLabel: jobLabel
serviceMonitor:
## Scrape interval. If not set, the Prometheus default scrape interval is used.
##
interval: ""
## How long until a scrape request times out. If not set, the Prometheus default scape timeout is used.
##
scrapeTimeout: ""
## metric relabel configs to apply to samples before ingestion.
##
metricRelabelings: []
# - sourceLabels: [__name__]
# separator: ;
# regex: ^node_mountstats_nfs_(event|operations|transport)_.+
# replacement: $1
# action: drop
## relabel configs to apply to samples before ingestion.
##
relabelings: []
# - sourceLabels: [__meta_kubernetes_pod_node_name]
# separator: ;
# regex: ^(.*)$
# targetLabel: nodename
# replacement: $1
# action: replace
## Configuration for prometheus-node-exporter subchart

##

prometheus-node-exporter:

  namespaceOverride: "monitoring"
podLabels:
## Add the 'node-exporter' label to be used by serviceMonitor to match standard common usage in rules and grafana dashboards
##
jobLabel: node-exporter
extraArgs:
- --collector.filesystem.ignored-mount-points=^/(dev|proc|sys|var/lib/docker/.+|var/lib/kubelet/.+)($|/)
- --collector.filesystem.ignored-fs-types=^(autofs|binfmt_misc|bpf|cgroup2?|configfs|debugfs|devpts|devtmpfs|fusectl|hugetlbfs|iso9660|mqueue|nsfs|overlay|proc|procfs|pstore|rpc_pipefs|securityfs|selinuxfs|squashfs|sysfs|tracefs)$
## Manages Prometheus and Alertmanager components
##
prometheusOperator:
enabled: true
## Prometheus-Operator v0.39.0 and later support TLS natively.
##
tls:
enabled: true
# Value must match version names from https://golang.org/pkg/crypto/tls/#pkg-constants
tlsMinVersion: VersionTLS13
# The default webhook port is 10250 in order to work out-of-the-box in GKE private clusters and avoid adding firewall rules.
internalPort: 10250
## Admission webhook support for PrometheusRules resources added in Prometheus Operator 0.30 can be enabled to prevent incorrectly formatted
## rules from making their way into prometheus and potentially preventing the container from starting
admissionWebhooks:
failurePolicy: Fail
enabled: true
## A PEM encoded CA bundle which will be used to validate the webhook's server certificate.
## If unspecified, system trust roots on the apiserver are used.
caBundle: ""
## If enabled, generate a self-signed certificate, then patch the webhook configurations with the generated data.
## On chart upgrades (or if the secret exists) the cert will not be re-generated. You can use this to provide your own
## certs ahead of time if you wish.
##
patch:
enabled: true
image:
repository: jettech/kube-webhook-certgen
tag: v1.5.0
sha: ""
pullPolicy: IfNotPresent
resources: {}
## Provide a priority class name to the webhook patching job
##
priorityClassName: ""
podAnnotations: {}
nodeSelector: {}
affinity: {}
tolerations: []
# Use certmanager to generate webhook certs
certManager:
enabled: false
# issuerRef:
# name: "issuer"
# kind: "ClusterIssuer"
## Namespaces to scope the interaction of the Prometheus Operator and the apiserver (allow list).
## This is mutually exclusive with denyNamespaces. Setting this to an empty object will disable the configuration
##
namespaces: {}
# releaseNamespace: true
# additional:
# - kube-system
## Namespaces not to scope the interaction of the Prometheus Operator (deny list).
##
denyNamespaces: []
## Filter namespaces to look for prometheus-operator custom resources
##
alertmanagerInstanceNamespaces: []
prometheusInstanceNamespaces: []
thanosRulerInstanceNamespaces: []
## The clusterDomain value will be added to the cluster.peer option of the alertmanager.
## Without this specified option cluster.peer will have value alertmanager-monitoring-alertmanager-0.alertmanager-operated:9094 (default value)
## With this specified option cluster.peer will have value alertmanager-monitoring-alertmanager-0.alertmanager-operated.namespace.svc.cluster-domain:9094
##
# clusterDomain: "cluster.local"
## Service account for Alertmanager to use.
## ref: https://kubernetes.io/docs/tasks/configure-pod-container/configure-service-account/
##
serviceAccount:
create: true
name: ""
## Configuration for Prometheus operator service
##
service:
annotations: {}
labels: {}
clusterIP: ""
## Port to expose on each node
## Only used if service.type is 'NodePort'
##
nodePort: 30080
nodePortTls: 30443
## Additional ports to open for Prometheus service
## ref: https://kubernetes.io/docs/concepts/services-networking/service/#multi-port-services
##
additionalPorts: []
## Loadbalancer IP
## Only use if service.type is "loadbalancer"
##
loadBalancerIP: ""
loadBalancerSourceRanges: []
## Service type
## NodePort, ClusterIP, loadbalancer
##
type: ClusterIP
## List of IP addresses at which the Prometheus server service is available
## Ref: https://kubernetes.io/docs/user-guide/services/#external-ips
##
externalIPs: []
## Labels to add to the operator pod
##
podLabels: {}
## Annotations to add to the operator pod
##
podAnnotations: {}
## Assign a PriorityClassName to pods if set
# priorityClassName: ""
## Define Log Format
# Use logfmt (default) or json logging
# logFormat: logfmt
## Decrease log verbosity to errors only
# logLevel: error
## If true, the operator will create and maintain a service for scraping kubelets
## ref: https://github.com/prometheus-operator/prometheus-operator/blob/master/helm/prometheus-operator/README.md
##
kubeletService:
enabled: true
namespace: kube-system
## Create a servicemonitor for the operator
##
serviceMonitor:
## Scrape interval. If not set, the Prometheus default scrape interval is used.
##
interval: ""
## Scrape timeout. If not set, the Prometheus default scrape timeout is used.
scrapeTimeout: ""
selfMonitor: true
## metric relabel configs to apply to samples before ingestion.
##
metricRelabelings: []
# - action: keep
# regex: 'kube_(daemonset|deployment|pod|namespace|node|statefulset).+'
# sourceLabels: [__name__]
# relabel configs to apply to samples before ingestion.
##
relabelings: []
# - sourceLabels: [__meta_kubernetes_pod_node_name]
# separator: ;
# regex: ^(.*)$
# targetLabel: nodename
# replacement: $1
# action: replace
## Resource limits & requests
##
resources: {}
# limits:
# cpu: 200m
# memory: 200Mi
# requests:
# cpu: 100m
# memory: 100Mi
# Required for use in managed kubernetes clusters (such as AWS EKS) with custom CNI (such as calico),
# because control-plane managed by AWS cannot communicate with pods' IP CIDR and admission webhooks are not working
##
hostNetwork: false
## Define which Nodes the Pods are scheduled on.
## ref: https://kubernetes.io/docs/user-guide/node-selection/
##
nodeSelector: {}
## Tolerations for use with node taints
## ref: https://kubernetes.io/docs/concepts/configuration/taint-and-toleration/
##
tolerations: []
# - key: "key"
# operator: "Equal"
# value: "value"
# effect: "NoSchedule"
## Assign custom affinity rules to the prometheus operator
## ref: https://kubernetes.io/docs/concepts/configuration/assign-pod-node/
##
affinity: {}
# nodeAffinity:
# requiredDuringSchedulingIgnoredDuringExecution:
# nodeSelectorTerms:
# - matchExpressions:
# - key: kubernetes.io/e2e-az-name
# operator: In
# values:
# - e2e-az1
# - e2e-az2
dnsConfig: {}
# nameservers:
# - 1.2.3.4
# searches:
# - ns1.svc.cluster-domain.example
# - my.dns.search.suffix
# options:
# - name: ndots
# value: "2"
# - name: edns0
securityContext:
fsGroup: 65534
runAsGroup: 65534
runAsNonRoot: true
runAsUser: 65534
## Prometheus-operator image
##
image:
repository: quay.io/prometheus-operator/prometheus-operator
tag: v0.45.0
sha: ""
pullPolicy: IfNotPresent
## Prometheus image to use for prometheuses managed by the operator
##
# prometheusDefaultBaseImage: quay.io/prometheus/prometheus
## Alertmanager image to use for alertmanagers managed by the operator
##
# alertmanagerDefaultBaseImage: quay.io/prometheus/alertmanager
## Prometheus-config-reloader image to use for config and rule reloading
##
prometheusConfigReloaderImage:
repository: quay.io/prometheus-operator/prometheus-config-reloader
tag: v0.45.0
sha: ""
## Set the prometheus config reloader side-car CPU limit
##
configReloaderCpu: 100m
## Set the prometheus config reloader side-car memory limit
##
configReloaderMemory: 50Mi
## Set a Field Selector to filter watched secrets
##
secretFieldSelector: ""
## Deploy a Prometheus instance
##
prometheus:
enabled: true
## Annotations for Prometheus
##
annotations: {}
## Service account for Prometheuses to use.
## ref: https://kubernetes.io/docs/tasks/configure-pod-container/configure-service-account/
##
serviceAccount:
create: true
name: ""
# Service for thanos service discovery on sidecar
# Enable this can make Thanos Query can use
# `--store=dnssrv+_grpc._tcp.${kube-prometheus-stack.fullname}-thanos-discovery.${namespace}.svc.cluster.local` to discovery
# Thanos sidecar on prometheus nodes
# (Please remember to change ${kube-prometheus-stack.fullname} and ${namespace}. Not just copy and paste!)
thanosService:
enabled: false
annotations: {}
labels: {}
portName: grpc
port: 10901
targetPort: "grpc"
## Configuration for Prometheus service
##
service:
annotations: {}
labels: {}
clusterIP: ""
## Port for Prometheus Service to listen on
##
port: 9090
## To be used with a proxy extraContainer port
targetPort: 9090
## List of IP addresses at which the Prometheus server service is available
## Ref: https://kubernetes.io/docs/user-guide/services/#external-ips
##
externalIPs: []
## Port to expose on each node
## Only used if service.type is 'NodePort'
##
nodePort: 30090
## Loadbalancer IP
## Only use if service.type is "loadbalancer"
loadBalancerIP: ""
loadBalancerSourceRanges: []
## Service type
##
type: ClusterIP
sessionAffinity: ""
## Configuration for creating a separate Service for each statefulset Prometheus replica
##
servicePerReplica:
enabled: false
annotations: {}
## Port for Prometheus Service per replica to listen on
##
port: 9090
## To be used with a proxy extraContainer port
targetPort: 9090
## Port to expose on each node
## Only used if servicePerReplica.type is 'NodePort'
##
nodePort: 30091
## Loadbalancer source IP ranges
## Only used if servicePerReplica.type is "loadbalancer"
loadBalancerSourceRanges: []
## Service type
##
type: ClusterIP
## Configure pod disruption budgets for Prometheus
## ref: https://kubernetes.io/docs/tasks/run-application/configure-pdb/#specifying-a-poddisruptionbudget
## This configuration is immutable once created and will require the PDB to be deleted to be changed
## https://github.com/kubernetes/kubernetes/issues/45398
##
podDisruptionBudget:
enabled: false
minAvailable: 1
maxUnavailable: ""
# Ingress exposes thanos sidecar outside the cluster
thanosIngress:
enabled: false
# For Kubernetes >= 1.18 you should specify the ingress-controller via the field ingressClassName
# See https://kubernetes.io/blog/2020/04/02/improvements-to-the-ingress-api-in-kubernetes-1.18/#specifying-the-class-of-an-ingress
# ingressClassName: nginx
annotations: {}
labels: {}
servicePort: 10901
## Port to expose on each node
## Only used if service.type is 'NodePort'
##
nodePort: 30901
## Hosts must be provided if Ingress is enabled.
##
hosts: []
# - thanos-gateway.domain.com
## Paths to use for ingress rules
##
paths: []
# - /
## For Kubernetes >= 1.18 you should specify the pathType (determines how Ingress paths should be matched)
## See https://kubernetes.io/blog/2020/04/02/improvements-to-the-ingress-api-in-kubernetes-1.18/#better-path-matching-with-path-types
# pathType: ImplementationSpecific
## TLS configuration for Thanos Ingress
## Secret must be manually created in the namespace
##
tls: []
# - secretName: thanos-gateway-tls
# hosts:
# - thanos-gateway.domain.com
ingress:
enabled: true
# For Kubernetes >= 1.18 you should specify the ingress-controller via the field ingressClassName
# See https://kubernetes.io/blog/2020/04/02/improvements-to-the-ingress-api-in-kubernetes-1.18/#specifying-the-class-of-an-ingress
# ingressClassName: nginx
annotations: {}
labels: {}
## Hostnames.
## Must be provided if Ingress is enabled.
##
hosts:
- prometheus.prod.test.local
#hosts: []
## Paths to use for ingress rules - one path should match the prometheusSpec.routePrefix
##
paths:
- /
## For Kubernetes >= 1.18 you should specify the pathType (determines how Ingress paths should be matched)
## See https://kubernetes.io/blog/2020/04/02/improvements-to-the-ingress-api-in-kubernetes-1.18/#better-path-matching-with-path-types
# pathType: ImplementationSpecific
## TLS configuration for Prometheus Ingress
## Secret must be manually created in the namespace
##
tls: []
# - secretName: prometheus-general-tls
# hosts:
# - prometheus.example.com
## Configuration for creating an Ingress that will map to each Prometheus replica service
## prometheus.servicePerReplica must be enabled
##
ingressPerReplica:
enabled: false
# For Kubernetes >= 1.18 you should specify the ingress-controller via the field ingressClassName
# See https://kubernetes.io/blog/2020/04/02/improvements-to-the-ingress-api-in-kubernetes-1.18/#specifying-the-class-of-an-ingress
# ingressClassName: nginx
annotations: {}
labels: {}
## Final form of the hostname for each per replica ingress is
## {{ ingressPerReplica.hostPrefix }}-{{ $replicaNumber }}.{{ ingressPerReplica.hostDomain }}
##
## Prefix for the per replica ingress that will have `-$replicaNumber`
## appended to the end
hostPrefix: ""
## Domain that will be used for the per replica ingress
hostDomain: ""
## Paths to use for ingress rules
##
paths: []
# - /
## For Kubernetes >= 1.18 you should specify the pathType (determines how Ingress paths should be matched)
## See https://kubernetes.io/blog/2020/04/02/improvements-to-the-ingress-api-in-kubernetes-1.18/#better-path-matching-with-path-types
# pathType: ImplementationSpecific
## Secret name containing the TLS certificate for Prometheus per replica ingress
## Secret must be manually created in the namespace
tlsSecretName: ""
## Separated secret for each per replica Ingress. Can be used together with cert-manager
##
tlsSecretPerReplica:
enabled: false
## Final form of the secret for each per replica ingress is
## {{ tlsSecretPerReplica.prefix }}-{{ $replicaNumber }}
##
prefix: "prometheus"
## Configure additional options for default pod security policy for Prometheus
## ref: https://kubernetes.io/docs/concepts/policy/pod-security-policy/
podSecurityPolicy:
allowedCapabilities: []
allowedHostPaths: []
volumes: []
serviceMonitor:
## Scrape interval. If not set, the Prometheus default scrape interval is used.
##
interval: ""
selfMonitor: true
## scheme: HTTP scheme to use for scraping. Can be used with `tlsConfig` for example if using istio mTLS.
scheme: ""
## tlsConfig: TLS configuration to use when scraping the endpoint. For example if using istio mTLS.
## Of type: https://github.com/prometheus-operator/prometheus-operator/blob/master/Documentation/api.md#tlsconfig
tlsConfig: {}
bearerTokenFile:
## metric relabel configs to apply to samples before ingestion.
##
metricRelabelings: []
# - action: keep
# regex: 'kube_(daemonset|deployment|pod|namespace|node|statefulset).+'
# sourceLabels: [__name__]
# relabel configs to apply to samples before ingestion.
##
relabelings: []
# - sourceLabels: [__meta_kubernetes_pod_node_name]
# separator: ;
# regex: ^(.*)$
# targetLabel: nodename
# replacement: $1
# action: replace
## Settings affecting prometheusSpec
## ref: https://github.com/prometheus-operator/prometheus-operator/blob/master/Documentation/api.md#prometheusspec
##
prometheusSpec:
## If true, pass --storage.tsdb.max-block-duration=2h to prometheus. This is already done if using Thanos
##
disableCompaction: false
## APIServerConfig
## ref: https://github.com/prometheus-operator/prometheus-operator/blob/master/Documentation/api.md#apiserverconfig
##
apiserverConfig: {}
## Interval between consecutive scrapes.
## Defaults to 30s.
## ref: https://github.com/prometheus-operator/prometheus-operator/blob/release-0.44/pkg/prometheus/promcfg.go#L180-L183
##
scrapeInterval: ""
## Number of seconds to wait for target to respond before erroring
##
scrapeTimeout: ""
## Interval between consecutive evaluations.
##
evaluationInterval: ""
## ListenLocal makes the Prometheus server listen on loopback, so that it does not bind against the Pod IP.
##
listenLocal: false
## EnableAdminAPI enables Prometheus the administrative HTTP API which includes functionality such as deleting time series.
## This is disabled by default.
## ref: https://prometheus.io/docs/prometheus/latest/querying/api/#tsdb-admin-apis
##
enableAdminAPI: false
## Image of Prometheus.
##
image:
repository: quay.io/prometheus/prometheus
tag: v2.24.0
sha: ""
## Tolerations for use with node taints
## ref: https://kubernetes.io/docs/concepts/configuration/taint-and-toleration/
##
tolerations: []
# - key: "key"
# operator: "Equal"
# value: "value"
# effect: "NoSchedule"
## If specified, the pod's topology spread constraints.
## ref: https://kubernetes.io/docs/concepts/workloads/pods/pod-topology-spread-constraints/
##
topologySpreadConstraints: []
# - maxSkew: 1
# topologyKey: topology.kubernetes.io/zone
# whenUnsatisfiable: DoNotSchedule
# labelSelector:
# matchLabels:
# app: prometheus
## Alertmanagers to which alerts will be sent
## ref: https://github.com/prometheus-operator/prometheus-operator/blob/master/Documentation/api.md#alertmanagerendpoints
##
## Default configuration will connect to the alertmanager deployed as part of this release
##
alertingEndpoints: []
# - name: ""
# namespace: ""
# port: http
# scheme: http
# pathPrefix: ""
# tlsConfig: {}
# bearerTokenFile: ""
# apiVersion: v2
## External labels to add to any time series or alerts when communicating with external systems
##
externalLabels: {}
## Name of the external label used to denote replica name
##
replicaExternalLabelName: ""
## If true, the Operator won't add the external label used to denote replica name
##
replicaExternalLabelNameClear: false
## Name of the external label used to denote Prometheus instance name
##
prometheusExternalLabelName: ""
## If true, the Operator won't add the external label used to denote Prometheus instance name
##
prometheusExternalLabelNameClear: false
## External URL at which Prometheus will be reachable.
##
externalUrl: ""
## Define which Nodes the Pods are scheduled on.
## ref: https://kubernetes.io/docs/user-guide/node-selection/
##
nodeSelector: {}
## Secrets is a list of Secrets in the same namespace as the Prometheus object, which shall be mounted into the Prometheus Pods.
## The Secrets are mounted into /etc/prometheus/secrets/. Secrets changes after initial creation of a Prometheus object are not
## reflected in the running Pods. To change the secrets mounted into the Prometheus Pods, the object must be deleted and recreated
## with the new list of secrets.
##
secrets: []
## ConfigMaps is a list of ConfigMaps in the same namespace as the Prometheus object, which shall be mounted into the Prometheus Pods.
## The ConfigMaps are mounted into /etc/prometheus/configmaps/.
##
configMaps: []
## QuerySpec defines the query command line flags when starting Prometheus.
## ref: https://github.com/prometheus-operator/prometheus-operator/blob/master/Documentation/api.md#queryspec
##
query: {}
## Namespaces to be selected for PrometheusRules discovery.
## If nil, select own namespace. Namespaces to be selected for ServiceMonitor discovery.
## See https://github.com/prometheus-operator/prometheus-operator/blob/master/Documentation/api.md#namespaceselector for usage
##
ruleNamespaceSelector: {}
## If true, a nil or {} value for prometheus.prometheusSpec.ruleSelector will cause the
## prometheus resource to be created with selectors based on values in the helm deployment,
## which will also match the PrometheusRule resources created
##
ruleSelectorNilUsesHelmValues: true
## PrometheusRules to be selected for target discovery.
## If {}, select all ServiceMonitors
##
ruleSelector: {}
## Example which select all prometheusrules resources
## with label "prometheus" with values any of "example-rules" or "example-rules-2"
# ruleSelector:
# matchExpressions:
# - key: prometheus
# operator: In
# values:
# - example-rules
# - example-rules-2
#
## Example which select all prometheusrules resources with label "role" set to "example-rules"
# ruleSelector:
# matchLabels:
# role: example-rules
## If true, a nil or {} value for prometheus.prometheusSpec.serviceMonitorSelector will cause the
## prometheus resource to be created with selectors based on values in the helm deployment,
## which will also match the servicemonitors created
##
serviceMonitorSelectorNilUsesHelmValues: true
## ServiceMonitors to be selected for target discovery.
## If {}, select all ServiceMonitors
##
serviceMonitorSelector: {}
## Example which selects ServiceMonitors with label "prometheus" set to "somelabel"
# serviceMonitorSelector:
# matchLabels:
# prometheus: somelabel
    ## Namespaces to be selected for ServiceMonitor discovery.

    ##

    serviceMonitorNamespaceSelector:

       matchLabels:

         prometheus: enabled
## Example which selects ServiceMonitors in namespaces with label "prometheus" set to "somelabel"
# serviceMonitorNamespaceSelector:
# matchLabels:
# prometheus: somelabel
## If true, a nil or {} value for prometheus.prometheusSpec.podMonitorSelector will cause the
## prometheus resource to be created with selectors based on values in the helm deployment,
## which will also match the podmonitors created
##
podMonitorSelectorNilUsesHelmValues: true
## PodMonitors to be selected for target discovery.
## If {}, select all PodMonitors
##
podMonitorSelector: {}
## Example which selects PodMonitors with label "prometheus" set to "somelabel"
# podMonitorSelector:
# matchLabels:
# prometheus: somelabel
## Namespaces to be selected for PodMonitor discovery.
## See https://github.com/prometheus-operator/prometheus-operator/blob/master/Documentation/api.md#namespaceselector for usage
##
podMonitorNamespaceSelector: {}
## If true, a nil or {} value for prometheus.prometheusSpec.probeSelector will cause the
## prometheus resource to be created with selectors based on values in the helm deployment,
## which will also match the probes created
##
probeSelectorNilUsesHelmValues: true
## Probes to be selected for target discovery.
## If {}, select all Probes
##
probeSelector: {}
## Example which selects Probes with label "prometheus" set to "somelabel"
# probeSelector:
# matchLabels:
# prometheus: somelabel
## Namespaces to be selected for Probe discovery.
## See https://github.com/prometheus-operator/prometheus-operator/blob/master/Documentation/api.md#namespaceselector for usage
##
probeNamespaceSelector: {}
## How long to retain metrics
##
retention: 10d
## Maximum size of metrics
##
retentionSize: ""
## Enable compression of the write-ahead log using Snappy.
##
walCompression: false
## If true, the Operator won't process any Prometheus configuration changes
##
paused: false
## Number of replicas of each shard to deploy for a Prometheus deployment.
## Number of replicas multiplied by shards is the total number of Pods created.
##
replicas: 1
## EXPERIMENTAL: Number of shards to distribute targets onto.
## Number of replicas multiplied by shards is the total number of Pods created.
## Note that scaling down shards will not reshard data onto remaining instances, it must be manually moved.
## Increasing shards will not reshard data either but it will continue to be available from the same instances.
## To query globally use Thanos sidecar and Thanos querier or remote write data to a central location.
## Sharding is done on the content of the `__address__` target meta-label.
##
shards: 1
## Log level for Prometheus be configured in
##
logLevel: info
## Log format for Prometheus be configured in
##
logFormat: logfmt
## Prefix used to register routes, overriding externalUrl route.
## Useful for proxies that rewrite URLs.
##
routePrefix: /
## Standard object’s metadata. More info: https://github.com/kubernetes/community/blob/master/contributors/devel/sig-architecture/api-conventions.md#metadata
## Metadata Labels and Annotations gets propagated to the prometheus pods.
##
podMetadata: {}
# labels:
# app: prometheus
# k8s-app: prometheus
## Pod anti-affinity can prevent the scheduler from placing Prometheus replicas on the same node.
## The default value "soft" means that the scheduler should *prefer* to not schedule two replica pods onto the same node but no guarantee is provided.
## The value "hard" means that the scheduler is *required* to not schedule two replica pods onto the same node.
## The value "" will disable pod anti-affinity so that no anti-affinity rules will be configured.
podAntiAffinity: ""
## If anti-affinity is enabled sets the topologyKey to use for anti-affinity.
## This can be changed to, for example, failure-domain.beta.kubernetes.io/zone
##
podAntiAffinityTopologyKey: kubernetes.io/hostname
## Assign custom affinity rules to the prometheus instance
## ref: https://kubernetes.io/docs/concepts/configuration/assign-pod-node/
##
affinity: {}
# nodeAffinity:
# requiredDuringSchedulingIgnoredDuringExecution:
# nodeSelectorTerms:
# - matchExpressions:
# - key: kubernetes.io/e2e-az-name
# operator: In
# values:
# - e2e-az1
# - e2e-az2
## The remote_read spec configuration for Prometheus.
## ref: https://github.com/prometheus-operator/prometheus-operator/blob/master/Documentation/api.md#remotereadspec
remoteRead: []
# - url: http://remote1/read
## The remote_write spec configuration for Prometheus.
## ref: https://github.com/prometheus-operator/prometheus-operator/blob/master/Documentation/api.md#remotewritespec
remoteWrite: []
# - url: http://remote1/push
## Enable/Disable Grafana dashboards provisioning for prometheus remote write feature
remoteWriteDashboards: false
## Resource limits & requests
##
resources: {}
# requests:
# memory: 400Mi
## Prometheus StorageSpec for persistent data
## ref: https://github.com/prometheus-operator/prometheus-operator/blob/master/Documentation/user-guides/storage.md
##
storageSpec:
## Using PersistentVolumeClaim
##
volumeClaimTemplate:
spec:
storageClassName: nfs-storageclass
accessModes: ["ReadWriteMany"]
resources:
requests:
storage: 10Gi
# selector: {}
## Using tmpfs volume
##
# emptyDir:
# medium: Memory
# Additional volumes on the output StatefulSet definition.
volumes: []
# Additional VolumeMounts on the output StatefulSet definition.
volumeMounts: []
## AdditionalScrapeConfigs allows specifying additional Prometheus scrape configurations. Scrape configurations
## are appended to the configurations generated by the Prometheus Operator. Job configurations must have the form
## as specified in the official Prometheus documentation:
## https://prometheus.io/docs/prometheus/latest/configuration/configuration/#scrape_config. As scrape configs are
## appended, the user is responsible to make sure it is valid. Note that using this feature may expose the possibility
## to break upgrades of Prometheus. It is advised to review Prometheus release notes to ensure that no incompatible
## scrape configs are going to break Prometheus after the upgrade.
##
## The scrape configuration example below will find master nodes, provided they have the name .*mst.*, relabel the
## port to 2379 and allow etcd scraping provided it is running on all Kubernetes master nodes
##
additionalScrapeConfigs: []
# - job_name: kube-etcd
# kubernetes_sd_configs:
# - role: node
# scheme: https
# tls_config:
# ca_file: /etc/prometheus/secrets/etcd-client-cert/etcd-ca
# cert_file: /etc/prometheus/secrets/etcd-client-cert/etcd-client
# key_file: /etc/prometheus/secrets/etcd-client-cert/etcd-client-key
# relabel_configs:
# - action: labelmap
# regex: __meta_kubernetes_node_label_(.+)
# - source_labels: [__address__]
# action: replace
# targetLabel: __address__
# regex: ([^:;]+):(d+)
# replacement: ${1}:2379
# - source_labels: [__meta_kubernetes_node_name]
# action: keep
# regex: .*mst.*
# - source_labels: [__meta_kubernetes_node_name]
# action: replace
# targetLabel: node
# regex: (.*)
# replacement: ${1}
# metric_relabel_configs:
# - regex: (kubernetes_io_hostname|failure_domain_beta_kubernetes_io_region|beta_kubernetes_io_os|beta_kubernetes_io_arch|beta_kubernetes_io_instance_type|failure_domain_beta_kubernetes_io_zone)
# action: labeldrop
## If additional scrape configurations are already deployed in a single secret file you can use this section.
## Expected values are the secret name and key
## Cannot be used with additionalScrapeConfigs
additionalScrapeConfigsSecret: {}
# enabled: false
# name:
# key:
## additionalPrometheusSecretsAnnotations allows to add annotations to the kubernetes secret. This can be useful
## when deploying via spinnaker to disable versioning on the secret, strategy.spinnaker.io/versioned: 'false'
additionalPrometheusSecretsAnnotations: {}
## AdditionalAlertManagerConfigs allows for manual configuration of alertmanager jobs in the form as specified
## in the official Prometheus documentation https://prometheus.io/docs/prometheus/latest/configuration/configuration/#<alertmanager_config>.
## AlertManager configurations specified are appended to the configurations generated by the Prometheus Operator.
## As AlertManager configs are appended, the user is responsible to make sure it is valid. Note that using this
## feature may expose the possibility to break upgrades of Prometheus. It is advised to review Prometheus release
## notes to ensure that no incompatible AlertManager configs are going to break Prometheus after the upgrade.
##
additionalAlertManagerConfigs: []
# - consul_sd_configs:
# - server: consul.dev.test:8500
# scheme: http
# datacenter: dev
# tag_separator: ','
# services:
# - metrics-prometheus-alertmanager
## AdditionalAlertRelabelConfigs allows specifying Prometheus alert relabel configurations. Alert relabel configurations specified are appended
## to the configurations generated by the Prometheus Operator. Alert relabel configurations specified must have the form as specified in the
## official Prometheus documentation: https://prometheus.io/docs/prometheus/latest/configuration/configuration/#alert_relabel_configs.
## As alert relabel configs are appended, the user is responsible to make sure it is valid. Note that using this feature may expose the
## possibility to break upgrades of Prometheus. It is advised to review Prometheus release notes to ensure that no incompatible alert relabel
## configs are going to break Prometheus after the upgrade.
##
additionalAlertRelabelConfigs: []
# - separator: ;
# regex: prometheus_replica
# replacement: $1
# action: labeldrop
## SecurityContext holds pod-level security attributes and common container settings.
## This defaults to non root user with uid 1000 and gid 2000.
## https://github.com/prometheus-operator/prometheus-operator/blob/master/Documentation/api.md
##
securityContext:
runAsGroup: 2000
runAsNonRoot: true
runAsUser: 1000
fsGroup: 2000
## Priority class assigned to the Pods
##
priorityClassName: ""
## Thanos configuration allows configuring various aspects of a Prometheus server in a Thanos environment.
## This section is experimental, it may change significantly without deprecation notice in any release.
## This is experimental and may change significantly without backward compatibility in any release.
## ref: https://github.com/prometheus-operator/prometheus-operator/blob/master/Documentation/api.md#thanosspec
##
thanos: {}
## Containers allows injecting additional containers. This is meant to allow adding an authentication proxy to a Prometheus pod.
## if using proxy extraContainer update targetPort with proxy container port
containers: []
## InitContainers allows injecting additional initContainers. This is meant to allow doing some changes
## (permissions, dir tree) on mounted volumes before starting prometheus
initContainers: []
## PortName to use for Prometheus.
##
portName: "web"
## ArbitraryFSAccessThroughSMs configures whether configuration based on a service monitor can access arbitrary files
## on the file system of the Prometheus container e.g. bearer token files.
arbitraryFSAccessThroughSMs: false
## OverrideHonorLabels if set to true overrides all user configured honor_labels. If HonorLabels is set in ServiceMonitor
## or PodMonitor to true, this overrides honor_labels to false.
overrideHonorLabels: false
## OverrideHonorTimestamps allows to globally enforce honoring timestamps in all scrape configs.
overrideHonorTimestamps: false
## IgnoreNamespaceSelectors if set to true will ignore NamespaceSelector settings from the podmonitor and servicemonitor
## configs, and they will only discover endpoints within their current namespace. Defaults to false.
ignoreNamespaceSelectors: false
## PrometheusRulesExcludedFromEnforce - list of prometheus rules to be excluded from enforcing of adding namespace labels.
## Works only if enforcedNamespaceLabel set to true. Make sure both ruleNamespace and ruleName are set for each pair
prometheusRulesExcludedFromEnforce: false
## QueryLogFile specifies the file to which PromQL queries are logged. Note that this location must be writable,
## and can be persisted using an attached volume. Alternatively, the location can be set to a stdout location such
## as /dev/stdout to log querie information to the default Prometheus log stream. This is only available in versions
## of Prometheus >= 2.16.0. For more details, see the Prometheus docs (https://prometheus.io/docs/guides/query-log/)
queryLogFile: false
## EnforcedSampleLimit defines global limit on number of scraped samples that will be accepted. This overrides any SampleLimit
## set per ServiceMonitor or/and PodMonitor. It is meant to be used by admins to enforce the SampleLimit to keep overall
## number of samples/series under the desired limit. Note that if SampleLimit is lower that value will be taken instead.
enforcedSampleLimit: false
## AllowOverlappingBlocks enables vertical compaction and vertical query merge in Prometheus. This is still experimental
## in Prometheus so it may change in any upcoming release.
allowOverlappingBlocks: false
additionalRulesForClusterRole: []
# - apiGroups: [ "" ]
# resources:
# - nodes/proxy
# verbs: [ "get", "list", "watch" ]
additionalServiceMonitors: []
## Name of the ServiceMonitor to create
##
#- name: ""
## Additional labels to set used for the ServiceMonitorSelector. Together with standard labels from
## the chart
##
# additionalLabels: {}
## Service label for use in assembling a job name of the form <label value>-<port>
## If no label is specified, the service name is used.
##
# jobLabel: ""
## labels to transfer from the kubernetes service to the target
##
# targetLabels: []
## labels to transfer from the kubernetes pods to the target
##
# podTargetLabels: []
## Label selector for services to which this ServiceMonitor applies
##
# selector: {}
## Namespaces from which services are selected
##
# namespaceSelector: []
## Match any namespace
##
# any: false
## Explicit list of namespace names to select
##
# matchNames: []
## Endpoints of the selected service to be monitored
##
# endpoints: []
## Name of the endpoint's service port
## Mutually exclusive with targetPort
# - port: ""
## Name or number of the endpoint's target port
## Mutually exclusive with port
# - targetPort: ""
## File containing bearer token to be used when scraping targets
##
# bearerTokenFile: ""
## Interval at which metrics should be scraped
##
# interval: 30s
## HTTP path to scrape for metrics
##
# path: /metrics
## HTTP scheme to use for scraping
##
# scheme: http
## TLS configuration to use when scraping the endpoint
##
# tlsConfig:
## Path to the CA file
##
# caFile: ""
## Path to client certificate file
##
# certFile: ""
## Skip certificate verification
##
# insecureSkipVerify: false
## Path to client key file
##
# keyFile: ""
## Server name used to verify host name
##
# serverName: ""
additionalPodMonitors: []
## Name of the PodMonitor to create
##
# - name: ""
## Additional labels to set used for the PodMonitorSelector. Together with standard labels from
## the chart
##
# additionalLabels: {}
## Pod label for use in assembling a job name of the form <label value>-<port>
## If no label is specified, the pod endpoint name is used.
##
# jobLabel: ""
## Label selector for pods to which this PodMonitor applies
##
# selector: {}
## PodTargetLabels transfers labels on the Kubernetes Pod onto the target.
##
# podTargetLabels: {}
## SampleLimit defines per-scrape limit on number of scraped samples that will be accepted.
##
# sampleLimit: 0
## Namespaces from which pods are selected
##
# namespaceSelector:
## Match any namespace
##
# any: false
## Explicit list of namespace names to select
##
# matchNames: []
## Endpoints of the selected pods to be monitored
## https://github.com/prometheus-operator/prometheus-operator/blob/master/Documentation/api.md#podmetricsendpoint
##
# podMetricsEndpoints: []
Настроим Elasticsearch-exporter
он есть в том же репозитории: https://github.com/prometheus-community/helm-charts.git с которого мы запускали сам prometheus, лежит он тут:
es:

  uri: http://elasticsearch-master:9200


serviceMonitor:

  ## If true, a ServiceMonitor CRD is created for a prometheus operator

  ## https://github.com/coreos/prometheus-operator

  ##

  enabled: true

  namespace: monitoring

  labels:

    app: elasticsearch-master

    release: prometheus

  interval: 10s

  scrapeTimeout: 10s

  scheme: http

  relabelings: []

  targetLabels:

    app: elasticsearch-master

    release: prometheus

  metricRelabelings: []

  sampleLimit: 0
в полном виде конфиг выглядит так:
## number of exporter instances

##

replicaCount: 1


## restart policy for all containers

##

restartPolicy: Always


image:

  repository: justwatch/elasticsearch_exporter

  tag: 1.1.0

  pullPolicy: IfNotPresent

  pullSecret: ""


## Set enabled to false if you don't want securityContext

## in your Deployment.

## The below values are the default for kubernetes.

## Openshift won't deploy with runAsUser: 1000 without additional permissions.

securityContext:

  enabled: true  # Should be set to false when running on OpenShift

  runAsUser: 1000


# Custom DNS configuration to be added to prometheus-elasticsearch-exporter pods

dnsConfig: {}

# nameservers:

#   - 1.2.3.4

# searches:

#   - ns1.svc.cluster-domain.example

#   - my.dns.search.suffix

# options:

#   - name: ndots

#     value: "2"

#   - name: edns0


log:

  format: logfmt

  level: info


resources: {}

  # requests:

  #   cpu: 100m

  #   memory: 128Mi

  # limits:

  #   cpu: 100m

  #   memory: 128Mi


priorityClassName: ""


nodeSelector: {}


tolerations: []


podAnnotations: {}


podLabels: {}


affinity: {}


service:

  type: ClusterIP

  httpPort: 9108

  metricsPort:

    name: http

  annotations: {}

  labels: {}


## Extra environment variables that will be passed into the exporter pod

## example:

## env:

##   KEY_1: value1

##   KEY_2: value2

env: {}


## The name of a secret in the same kubernetes namespace which contain values to be added to the environment

## This can be useful for auth tokens, etc

envFromSecret: ""


## A list of environment variables from secret refs that will be passed into the exporter pod

## example:

## This will set ${ES_PASSWORD} to the 'password' key from the 'my-secret' secret

## extraEnvSecrets:

##   ES_PASSWORD:

##     secret: my-secret

##     key: password

extraEnvSecrets: {}


# A list of secrets and their paths to mount inside the pod

# This is useful for mounting certificates for security

secretMounts: []

#  - name: elastic-certs

#    secretName: elastic-certs

#    path: /ssl


# A list of additional Volume to add to the deployment

# this is useful if the volume you need is not a secret (csi volume etc.)

extraVolumes: []

#  - name: csi-volume

#    csi:

#      driver: secrets-store.csi.k8s.io

#      readOnly: true

#      volumeAttributes:

#        secretProviderClass: my-spc


#  A list of additional VolumeMounts to add to the deployment

#  this is useful for mounting any other needed resource into

#  the elasticsearch-exporter pod

extraVolumeMounts: []

#  - name: csi-volume

#    mountPath: /csi/volume

#    readOnly: true


es:

  ## Address (host and port) of the Elasticsearch node we should connect to.

  ## This could be a local node (localhost:9200, for instance), or the address

  ## of a remote Elasticsearch server. When basic auth is needed,

  ## specify as: <proto>://<user>:<password>@<host>:<port>. e.g., http://admin:pass@localhost:9200.

  ##

  uri: http://elasticsearch-master:9200


  ## If true, query stats for all nodes in the cluster, rather than just the

  ## node we connect to.

  ##

  all: true


  ## If true, query stats for all indices in the cluster.

  ##

  indices: true


  ## If true, query settings stats for all indices in the cluster.

  ##

  indices_settings: true


  ## If true, query stats for shards in the cluster.

  ##

  shards: true


  ## If true, query stats for snapshots in the cluster.

  ##

  snapshots: true


  ## If true, query stats for cluster settings.

  ##

  cluster_settings: false


  ## Timeout for trying to get stats from Elasticsearch. (ex: 20s)

  ##

  timeout: 30s


  ## Skip SSL verification when connecting to Elasticsearch

  ## (only available if image.tag >= 1.0.4rc1)

  ##

  sslSkipVerify: false


  ssl:

    ## If true, a secure connection to ES cluster is used

    ##

    enabled: false


    ## If true, certs from secretMounts will be need to be referenced instead of certs below

    ##

    useExistingSecrets: false


    ca:


      ## PEM that contains trusted CAs used for setting up secure Elasticsearch connection

      ##

      # pem:


      # Path of ca pem file which should match a secretMount path

      path: /ssl/ca.pem

    client:

      ## if true, client SSL certificate is used for authentication

      ##

      enabled: true


      ## PEM that contains the client cert to connect to Elasticsearch.

      ##

      # pem:


      # Path of client pem file which should match a secretMount path

      pemPath: /ssl/client.pem


      ## Private key for client auth when connecting to Elasticsearch

      ##

      # key:


      # Path of client key file which should match a secretMount path

      keyPath: /ssl/client.key

web:

  ## Path under which to expose metrics.

  ##

  path: /metrics


serviceMonitor:

  ## If true, a ServiceMonitor CRD is created for a prometheus operator

  ## https://github.com/coreos/prometheus-operator

  ##

  enabled: true

  namespace: monitoring

  labels:

    app: elasticsearch-master

    release: prometheus

  interval: 10s

  scrapeTimeout: 10s

  scheme: http

  relabelings: []

  targetLabels:

    app: elasticsearch-master

    release: prometheus

  metricRelabelings: []

  sampleLimit: 0


prometheusRule:

  ## If true, a PrometheusRule CRD is created for a prometheus operator

  ## https://github.com/coreos/prometheus-operator

  ##

  ## The rules will be processed as Helm template, allowing to set variables in them.

  enabled: false

  #  namespace: monitoring

  labels: {}

  rules: []

    # - record: elasticsearch_filesystem_data_used_percent

    #   expr: |

    #     100 * (elasticsearch_filesystem_data_size_bytes{service="{{ template "elasticsearch-exporter.fullname" . }}"} - elasticsearch_filesystem_data_free_bytes{service="{{ template "elasticsearch-exporter.fullname" . }}"})

    #     / elasticsearch_filesystem_data_size_bytes{service="{{ template "elasticsearch-exporter.fullname" . }}"}

    # - record: elasticsearch_filesystem_data_free_percent

    #   expr: 100 - elasticsearch_filesystem_data_used_percent{service="{{ template "elasticsearch-exporter.fullname" . }}"}

    # - alert: ElasticsearchTooFewNodesRunning

    #   expr: elasticsearch_cluster_health_number_of_nodes{service="{{ template "elasticsearch-exporter.fullname" . }}"} < 3

    #   for: 5m

    #   labels:

    #     severity: critical

    #   annotations:

    #     description: There are only {{ "{{ $value }}" }} < 3 ElasticSearch nodes running

    #     summary: ElasticSearch running on less than 3 nodes

    # - alert: ElasticsearchHeapTooHigh

    #   expr: |

    #     elasticsearch_jvm_memory_used_bytes{service="{{ template "elasticsearch-exporter.fullname" . }}", area="heap"} / elasticsearch_jvm_memory_max_bytes{service="{{ template "elasticsearch-exporter.fullname" . }}", area="heap"}

    #     > 0.9

    #   for: 15m

    #   labels:

    #     severity: critical

    #   annotations:

    #     description: The heap usage is over 90% for 15m

    #     summary: ElasticSearch node {{ "{{ $labels.node }}" }} heap usage is high


# Create a service account

# To use a service account not handled by the chart, set the name here

# and set create to false

serviceAccount:

  create: false

  name: default


# Creates a PodSecurityPolicy and the role/rolebinding

# allowing the serviceaccount to use it

podSecurityPolicies:

  enabled: false
прогоняем label по всем namespace kubectl label namespace —all «prometheus=enabled»
у меня уже установлен redis в кластере в namespace redis, прометеус в namespace monitoring
пароль от redis у меня закрыт в секрете:
[root@prod-vsrv-kubemaster1 charts]# kubectl get secrets -n redis  | grep -E 'NAME|password'

NAME                                                   TYPE                                  DATA   AGE

redis-password                                         Opaque                                1      27h
vim prometheus-redis-exporter/values.yaml
redisAddress: redis://redis-cluster-headless.redis.svc.test.local:6379


serviceMonitor:

  enabled: true

  namespace: monitoring

  # Set labels for the ServiceMonitor, use this to define your scrape label for Prometheus Operator

  labels:

    release: prometheus


auth:

  # Use password authentication

  enabled: true

  # Use existing secret (ignores redisPassword)

  secret:

    name: redis-password

    key: redis-password
/newbot — отправляем ему и бот просит придумать имя нашему новому боту. Единственное ограничение на имя — оно должно оканчиваться на «bot». В случае успеха BotFather возвращает токен бота и ссылку для быстрого добавления бота в контакты, иначе придется поломать голову над именем.
всё мы зарегались, теперь этот токен можно использовать при подключении нашего алертменеджера к телеграму
cat default.tmpl
{{ define "telegram.default" }}

{{ range .Alerts }}

{{ if eq .Status "firing"}}?  <b>{{ .Status | toUpper }}</b> ? {{ else }}<b>{{ .Status | toUpper }}</b>{{ end }}

<b>{{ .Labels.alertname }}</b>

{{ .Annotations.message }} {{ .Annotations.description }}

<b>Duration:</b> {{ duration .StartsAt .EndsAt }}{{ if ne .Status "firing"}}

<b>Ended:</b> {{ .EndsAt | since }}{{ end }}

{{ end }}

{{ end }}
cat Dockerfile
FROM metalmatze/alertmanager-bot:0.4.2


COPY ./default.tmpl /templates/default.tmpl
admin1 — тут указываю хэши id пользователей которые будут заходить token — тут указываем токен нашего телеграм бота (хэш) namespace — тут указываем неймспейс в котором у нас запущен prometheus image — тут указываем образ телеграмбота пересобранного и загруженного в наш гитлаб — —telegram.admin — тут id пользователей в открытом виде
можем запускать: kubectl apply -f telegrambot.yml
всё можно проверять: пишем /start и бот отвечает:
6.1 настройка оповещений в telegram, в различные чаты(группы)
Задача — настроить оповещения в разные чаты телеграмма
за основу будет взят телеграм бот: https://github.com/inCaller/prometheus_bot который был заточен под helm chart https://github.com/gvych/telegram-bot-helm-chart отмечу сразу что его надо дописывать в values так как с нуля он не стартует.
приступим, создаём в телеграм новую группу:
добавляем нашего бота которого мы создали в предыдущем пункте, так как я дополняю статью позже, то имя бота у меня другое:
далее добавляем к группе бота который позволит увидеть chatid
6.2. настройка оповещений в telegram разграничение оповещений по группам (исключения уведомлений)
Вводная: есть админский чат и есть чат разработчиков. при настройке как в пункте 6.1 уведомления приходящие в чат разрабочиков дублируются и в чат админов.
данная ситуация происходит вообще потому, что alertmanager со следующим конфигом:
имеет настройку continue: true (по дефолту false) благодаря которой уведомления попав под первое правило не прекращаются а отправляются дальше по route и отправляются по другим receiver (когда совпадают по label)
правила совпадения работают не как OR а как AND (т.е. должны совпасть ВСЕ лейблы)
Задача, исключить из чата админов сообщения отправляемые в чат разрабочиков, чтобы админам прилетали все дефолтные
Решение — возможно тупенькое но я другого не нашёл, работать будет так:
прилетает сообщение, с лейблами: severity: «critical» team: «terminal-soft»
значит оно должно попасть только в группу terminal-soft, поэтому для receiver: «telegram-terminal-soft» оставляем match_re: team: «terminal-soft»
но так как в уведомлении будет прителать лейбл severity: «critical» то он будет попадать под совпадение receiver: «telegram-admins» у которого match_re: severity: «critical|warning»
нам этого не нужно поэтому для receiver: «telegram-terminal-soft» ставим continue: false и тогда обработка следующих routes не будет происходить.
вывод перед админским чатом правило должно быть с условием: continue: false а админский чат последний в списке.
а прометеус лезет на айпишник т.е. щимится на ноды а там ни кто не отвечает: [root@kub-master-1 charts]# telnet 192.168.1.205 10249 Trying 192.168.1.205… telnet: connect to address 192.168.1.205: Connection refused
что для исправления делаем, НА ВСЕХ НОДАХ правим:
[root@kub-master-1 charts]# vim /etc/kubernetes/kube-proxy-config.yaml c metricsBindAddress: 127.0.0.1:10249 на metricsBindAddress: 0.0.0.0:10249
[root@kub-master-1 charts]# kubectl delete pod -n kube-system kube-proxy-kub-master-1 kube-proxy-kub-master-2 kube-proxy-kub-master-3 kube-proxy-kub-worker-1 kube-proxy-kub-worker-2 pod «kube-proxy-kub-master-1» deleted pod «kube-proxy-kub-master-2» deleted pod «kube-proxy-kub-master-3» deleted pod «kube-proxy-kub-worker-1» deleted pod «kube-proxy-kub-worker-2» deleted
Проверяем доступность:
[root@kub-master-1 charts]# telnet 192.168.1.205 10249 Trying 192.168.1.205… Connected to 192.168.1.205. Escape character is ‘^]’. ^] telnet> quit Connection closed.
и как видим метрики теперь отображаются:
8.Настройка алерта для определённого namespace
У меня есть тестовый сервис:
cat my-site-ingress.yaml
---

apiVersion: extensions/v1beta1

kind: Ingress

metadata:

  name: my-ingress

  namespace: my-site

spec:

  rules:

  - host: test.ru  #тут указывается наш домен

    http:

      paths:  #список путей которые хотим обслуживать(он дефолтный и все запросы будут отправляться на бэкенд, т.е. на сервис my-service-apache)

      - backend:

          serviceName: my-service-apache  #тут указывается наш сервис

          servicePort: 80 #порт на котором сервис слушает

#        path: /  все запросы на корень '/' будут уходить на наш сервис
cat my-site-service.yaml
---

apiVersion: v1

kind: Service

metadata:

  name: my-service-apache # имя сервиса

  namespace: my-site

spec:

  ports:

  - port: 80  # принимать на 80

    targetPort: 80 # отправлять на 80

  selector:

    app: apache  #отправлять на все поды с данным лейблом

  type: ClusterIP
cat my-site.yaml
---

apiVersion: apps/v1

kind: Deployment

metadata:

  name: my-deployment-apache

  namespace: my-site

spec:

  replicas: 1

  selector:

    matchLabels:

      app: apache # по вот этому лейблу репликасет цепляет под

# тут описывается каким мокаром следует обновлять поды

  strategy:

    rollingUpdate:

      maxSurge: 1  # указывает на какое количество реплик можно увеличить

      maxUnavailable: 1 # указывает на какое количество реплик можно уменьшить

#т.е. в одно время при обновлении, будет увеличено на один (новый под) и уменьшено на один (старый под)

    type: RollingUpdate

## тут начинается описание контейнера

  template:

    metadata:

      labels:

        app: apache  # по вот этому лейблу репликасет цепляет под

    spec:

      containers:

        - image: httpd:2.4.43

          name: apache

          ports:

            - containerPort: 80

# тут начинаются проверки по доступности

          readinessProbe: # проверка готово ли приложение

            failureThreshold: 3 #указывает количество провалов при проверке

            httpGet:  # по сути дёргает курлом на 80 порт

              path: /

              port: 80

            periodSeconds: 10 #как часто должна проходить проверка (в секундах)

            successThreshold: 1 #сбрасывает счётчик неудач, т.е. при 3х проверках если 1 раз успешно прошло, то счётчик сбрасывается и всё ок

            timeoutSeconds: 1 #таймаут на выполнение пробы 1 секунда

          livenessProbe: #проверка на жизнь приложения, живо ли оно

            failureThreshold: 3

            httpGet:

              path: /

              port: 80

            periodSeconds: 10

            successThreshold: 1

            timeoutSeconds: 1

            initialDelaySeconds: 10 #означает что первую проверку надо сделать только после 10 секунд


# тут начинается описание лимитов для пода

          resources:

            requests: #количество ресурсов которые резервируются для pod на ноде

              cpu: 60m

              memory: 200Mi

            limits: #количество ресурсов которые pod может использовать(верхняя граница)

              cpu: 120m

              memory: 300Mi
[root@kub-master-1 ~]# kubectl get pod -n my-site

NAME                                    READY   STATUS    RESTARTS   AGE

my-deployment-apache-859486bd8c-zk99f   1/1     Running   0          11m
как видим всё ок. теперь сделаем так чтобы сервис постоянно падал и перезапускался, для этого подправим в деплойменте проверки(readinessProbe/livenessProbe) порта не 80 а 81:
cat my-site.yaml

---

apiVersion: apps/v1

kind: Deployment

metadata:

  name: my-deployment-apache

  namespace: my-site

spec:

  replicas: 1

  selector:

    matchLabels:

      app: apache # по вот этому лейблу репликасет цепляет под

# тут описывается каким мокаром следует обновлять поды

  strategy:

    rollingUpdate:

      maxSurge: 1  # указывает на какое количество реплик можно увеличить

      maxUnavailable: 1 # указывает на какое количество реплик можно уменьшить

#т.е. в одно время при обновлении, будет увеличено на один (новый под) и уменьшено на один (старый под)

    type: RollingUpdate

## тут начинается описание контейнера

  template:

    metadata:

      labels:

        app: apache  # по вот этому лейблу репликасет цепляет под

    spec:

      containers:

        - image: httpd:2.4.43

          name: apache

          ports:

            - containerPort: 80

# тут начинаются проверки по доступности

          readinessProbe: # проверка готово ли приложение

            failureThreshold: 3 #указывает количество провалов при проверке

            httpGet:  # по сути дёргает курлом на 80 порт

              path: /

              port: 81

            periodSeconds: 10 #как часто должна проходить проверка (в секундах)

            successThreshold: 1 #сбрасывает счётчик неудач, т.е. при 3х проверках если 1 раз успешно прошло, то счётчик сбрасывается и всё ок

            timeoutSeconds: 1 #таймаут на выполнение пробы 1 секунда

          livenessProbe: #проверка на жизнь приложения, живо ли оно

            failureThreshold: 3

            httpGet:

              path: /

              port: 81

            periodSeconds: 10

            successThreshold: 1

            timeoutSeconds: 1

            initialDelaySeconds: 10 #означает что первую проверку надо сделать только после 10 секунд


# тут начинается описание лимитов для пода

          resources:

            requests: #количество ресурсов которые резервируются для pod на ноде

              cpu: 60m

              memory: 200Mi

            limits: #количество ресурсов которые pod может использовать(верхняя граница)

              cpu: 120m

              memory: 300Mi
и применим:
kubectl apply -f my-site.yaml
как видим pod перезапускается:
[root@kub-master-1 ~]# kubectl get pod -n my-site

NAME                                    READY   STATUS    RESTARTS   AGE

my-deployment-apache-85978bf68f-mbwlm   0/1     Running   1          41s
который смотрит статус контейнеров по namespace my-site за последние 5 минут.
как видим у нас 2 разных имени контейнера: my-deployment-apache-859486bd8c-zk99f (который был запущен ранее и с ним было всё нормально) и my-deployment-apache-85978bf68f-mbwlm (текущий, который был специально сломан через неправильные проверки)
теперь нам надо получить результат, были ли за последние 5 минуть незапущенные контейнеры, для этого используем следующий запрос:
spec:

  groups:

  - name: alertmanager.rules

    rules:

    - alert: AlertmanagerConfigInconsistent

      annotations:

        message: |

          The configuration of the instances of the Alertmanager cluster `{{ $labels.namespace }}/{{ $labels.service }}` are out of sync.

          {{ range printf "alertmanager_config_hash{namespace="%s",service="%s"}" $labels.namespace $labels.service | query }}

          Configuration hash for pod {{ .Labels.pod }} is "{{ printf "%.f" .Value }}"

          {{ end }}

      expr: count by(namespace,service) (count_values by(namespace,service) ("config_hash",

        alertmanager_config_hash{job="prometheus-kube-prometheus-alertmanager",namespace="monitoring"}))

        != 1

      for: 5m

      labels:

        severity: critical

    - alert: AlertmanagerFailedReload

      annotations:

        message: Reloading Alertmanager's configuration has failed for {{ $labels.namespace

          }}/{{ $labels.pod}}.

      expr: alertmanager_config_last_reload_successful{job="prometheus-kube-prometheus-alertmanager",namespace="monitoring"}

        == 0

      for: 10m

      labels:

        severity: warning

    - alert: AlertmanagerMembersInconsistent

      annotations:

        message: Alertmanager has not found all other members of the cluster.

      expr: |-

        alertmanager_cluster_members{job="prometheus-kube-prometheus-alertmanager",namespace="monitoring"}

          != on (service) GROUP_LEFT()

        count by (service) (alertmanager_cluster_members{job="prometheus-kube-prometheus-alertmanager",namespace="monitoring"})

      for: 5m

      labels:

        severity: critical
в прометеусе переходим на вкладку alerts и видим наше правило:
всё теперь можно снова ломать проверки в нашем деплойменте и проверять полетел ли алерт:
как видим полетел.
проверяем наш телеграм бот и видим:
в таком вот виде настраивается алертинг.
Теперь рассмотрим как нам добавлять свой алертинг а не править имеющийся.
смотрим имеющие правила:
[root@kub-master-1 ~]# kubectl -n monitoring get prometheusrules.monitoring.coreos.com

NAME                                                              AGE

prometheus-kube-prometheus-alertmanager.rules                     3d

prometheus-kube-prometheus-etcd                                   3d

prometheus-kube-prometheus-general.rules                          3d

prometheus-kube-prometheus-k8s.rules                              3d

prometheus-kube-prometheus-kube-apiserver-availability.rules      3d

prometheus-kube-prometheus-kube-apiserver-slos                    3d

prometheus-kube-prometheus-kube-apiserver.rules                   3d

prometheus-kube-prometheus-kube-prometheus-general.rules          3d

prometheus-kube-prometheus-kube-prometheus-node-recording.rules   3d

prometheus-kube-prometheus-kube-scheduler.rules                   3d

prometheus-kube-prometheus-kube-state-metrics                     3d

prometheus-kube-prometheus-kubelet.rules                          3d

prometheus-kube-prometheus-kubernetes-apps                        3d

prometheus-kube-prometheus-kubernetes-resources                   3d

prometheus-kube-prometheus-kubernetes-storage                     3d

prometheus-kube-prometheus-kubernetes-system                      3d

prometheus-kube-prometheus-kubernetes-system-apiserver            3d

prometheus-kube-prometheus-kubernetes-system-controller-manager   3d

prometheus-kube-prometheus-kubernetes-system-kubelet              3d

prometheus-kube-prometheus-kubernetes-system-scheduler            3d

prometheus-kube-prometheus-node-exporter                          3d

prometheus-kube-prometheus-node-exporter.rules                    3d

prometheus-kube-prometheus-node-network                           3d

prometheus-kube-prometheus-node.rules                             3d

prometheus-kube-prometheus-prometheus                             3d

prometheus-kube-prometheus-prometheus-operator                    3d
smtp_smarthost: 10.20.44.56:25 это наш smtp хост через который мы шлём почту.
receiver: ’email_unixadmins’ — на него будут идти оповещения вне зависимости от критичности алерта, для остальных можно выставлять уровень критичности.
она будет отображать только наш неймспейс terminal-soft создадим панель которая будет отображать сколько процессорного времени использует namespace запрос выглядит следующим образом:
в левой колонке ставим параметр, в чём измеряем (в нашем случае в байтах)
и настраиваем отображаему легенду а именно минимальные максимальные значение и т.д.
всё можно сохраняться
как видим 2 графика у нас уже отображаются нормально:
теперь отобразим занятое дисковое пространство persistantvolume
создаём новую панель
запрос будет выглядеть следующим образом: (kubelet_volume_stats_capacity_bytes{persistentvolumeclaim=»$volume»} — kubelet_volume_stats_available_bytes{persistentvolumeclaim=»$volume»}) / kubelet_volume_stats_capacity_bytes{persistentvolumeclaim=»$volume»} * 100
у нас повилась переменная volume рассмотрим как её создать:
переходим в настройки dasboard
добавим несколько переменных, первая cluster запрос: label_values(kubelet_volume_stats_capacity_bytes, cluster)
не забываем ставить Hide Variables чтобы в панели он не отображался
Кэш и файлы cookie идут рука об руку, когда дело доходит до просмотра веб-страниц. В то время как кеш хранит информацию о веб-сайте локально на вашем компьютере, файлы cookie запоминают ваши личные предпочтения веб-сайта, такие как элементы корзины, визуальные настройки и пароли, среди прочего.
Как правило, не рекомендуется очищать или удалять кэш и файлы cookie с компьютера; для этого есть две основные причины: во-первых, кеш предназначен для автоматического удаления из вашей системы. При этом некоторые кеши будут присутствовать в системе в течение нескольких дней, в то время как другие могут присутствовать в течение нескольких дней/лет.
Другая причина отказа от очистки кешей и файлов cookie заключается в том, что это приведет к выходу из всех ваших учетных записей и удалению ваших пользовательских настроек для веб-сайтов, что помешает вашему взаимодействию с пользователем при следующем посещении веб-сайта.
Однако, если вы столкнулись с проблемой или непредвиденным поведением на веб-сайте, очистка кеша и файлов cookie — это первый и главный шаг, который может помочь вам решить проблему.
1. Очистить кеш в Microsoft Edge
Очистка кеша в Microsoft Edge — простая задача, почти аналогичная процессу, присутствующему в других браузерах. Кроме того, вы также можете настроить браузер на автоматическую очистку кэшированных данных каждый раз, когда вы выходите из браузера.
В Microsoft Edge щелкните значок «Многоточие», а затем выберите параметр «Настройки». Это откроет новую вкладку.
После этого нажмите на опцию «Конфиденциальность, поиск и службы» на левой боковой панели страницы.
На странице «Конфиденциальность, поиск и службы» прокрутите вниз до раздела «Очистить данные браузера» и нажмите кнопку «Выберите, что нужно очистить», чтобы продолжить.
Откроется диалоговое окно «Очистить данные просмотра». Выберите временной диапазон, нажав кнопку раскрывающегося списка, и установите флажок рядом с параметром «Кэшированные изображения и файлы». Затем нажмите кнопку «Очистить сейчас».
Все, теперь кеш браузера очищен.
Автоматически очищать кеш при выходе
Автоматическая очистка кэшированных данных при закрытии Edge — отличная функция. Чтобы включить его, откройте настройки Microsoft Edge из параметров меню.
Как и в предыдущем способе, нажмите «Конфиденциальность, поиск и службы» на левой панели страницы.
Затем в разделе «Очистить данные браузера» нажмите «Выберите, что следует очищать каждый раз, когда вы закрываете браузер».
Затем нажмите тумблер, а затем «Кэшированные изображения и файлы», чтобы перевести его в положение «Вкл.».
Если вы не хотите очищать файлы cookie и другие данные определенного веб-сайта,нажмите кнопку «Добавить», как показано на изображении ниже.
Откроется новое диалоговое окно для ввода адреса веб-сайта. Введите адрес веб-сайта в текстовое поле под опцией «Сайт». Вы можете включить или отключить очистку сторонних веб-сайтов на этом конкретном сайте, установив или сняв флажок рядом с кнопкой. Затем нажмите кнопку «Добавить».
Microsoft Edge теперь будет автоматически очищать кеш при закрытии браузера, за исключением любых веб-сайтов, которые вы добавляете в исключения.
2. Очистите файлы cookie в Microsoft Edge.
Как упоминалось выше, файлы cookie — это пакеты информации, которые веб-сайты размещают в локальном хранилище вашего компьютера, чтобы запомнить ваши предпочтения. В Microsoft Edge вы можете очистить файлы cookie для всех веб-сайтов или для одного веб-сайта.
Чтобы удалить файлы cookie для всех веб-сайтов, на главном экране Microsoft Edge щелкните значок «Многоточие», а затем выберите параметр «Настройки».
После этого нажмите на опцию «Файлы cookie и разрешения сайта» на левой боковой панели.
Затем в правой части окна нажмите плитку «Управление и удаление файлов cookie и данных сайта», чтобы продолжить.
Теперь нажмите на опцию «Просмотреть все файлы cookie и данные сайта».
После этого нажмите кнопку «Удалить все», чтобы удалить все сохраненные файлы cookie для всех веб-сайтов.
Если вы хотите удалить файлы cookie только для одного веб-сайта, вы можете либо использовать панель поиска в правом верхнем углу страницы, либо вручную прокрутить вниз, чтобы найти веб-сайт. Найдя его, нажмите на него, чтобы продолжить.
Затем щелкните значок «Корзина», чтобы удалить файлы cookie из локального хранилища. Повторите процесс для каждого веб-сайта. Вот и все, вы успешно удалили файлы cookie для определенных веб-сайтов в Microsoft Edge.
Чтобы удалить файлы cookie для веб-сайта, открытого в данный момент в браузере, перейдите на вкладку, на которой открыт веб-сайт, и нажмите значок «Блокировка» в адресной строке. Затем нажмите на опцию «Cookies». Это откроет отдельное окно на вашем экране.
Теперь щелкните категорию файлов cookie, чтобы выбрать ее, и нажмите кнопку «Удалить», чтобы удалить файлы cookie из локального хранилища. Повторите процесс для каждой категории.
Вот и все, ребята. Если вы столкнулись с определенной проблемой на веб-сайте или в браузере, вы можете просто удалить файлы cookie и кеш, используя методы, упомянутые выше.
Драйверы являются одним из наиболее важных элементов на компьютере, поскольку они действуют как мост между программными и аппаратными компонентами. В этом случае драйвер принтера помогает распечатать цифровую информацию, отправляя на принтер определенные команды.
Если на вашем компьютере отсутствует драйвер принтера, он не сможет печатать какие-либо документы, фотографии и т.д. Однако его установка на ваш компьютер является очень простой и простой процедурой, практически не требующей усилий.
Более того, существует несколько способов установки драйвера на компьютер с Windows, а значит, вы можете выбрать наиболее удобный для себя.
Примечание. Прежде чем продолжить, убедитесь, что принтер подключен к компьютеру.
1. Проверьте наличие дополнительных обновлений
Если вы приобрели новый ПК или драйвер отсутствует после перезагрузки системы, весьма вероятно, что Windows обнаружила отсутствующий драйвер на серверах Microsoft, и он находится в очереди «Необязательные обновления». Обычно Windows сама управляет установкой обновлений, однако иногда вам может потребоваться вмешательство для их загрузки.
Сначала перейдите в меню «Пуск» и щелкните плитку «Настройки».
После этого нажмите на вкладку «Центр обновления Windows» на левой боковой панели.
Затем в правой части окна щелкните плитку «Дополнительные параметры».
Затем на следующем экране найдите и щелкните плитку «Необязательные обновления», чтобы продолжить.
После этого в списке доступных драйверов найдите драйвер принтера (который может иметь «принтер» в качестве суффикса или префикса) и установите флажок перед ним. Затем нажмите кнопку «Загрузить и установить».
Вам может быть предложено перезагрузить устройство. После перезагрузки драйвер теперь установлен на вашем компьютере.
2. Используйте диспетчер устройств
Если вы не можете найти драйвер принтера в разделе «Необязательные обновления», вы также можете вручную найти доступные драйверы на серверах Microsoft с помощью диспетчера устройств. Хотя это может быть не так удобно, как предыдущий метод, это следующий лучший вариант.
Сначала перейдите в меню «Пуск» и введитеDevice поиск. Затем щелкните плитку «Диспетчер устройств».
После этого щелкните правой кнопкой мыши параметр «Принтеры», чтобы продолжить. Затем нажмите «Сканировать на предмет изменений оборудования».
Теперь щелкните правой кнопкой мыши устройство, для которого вы хотите установить драйвер, и выберите параметр «Обновить драйвер». Это откроет отдельное окно на вашем экране.
Теперь нажмите на опцию «Поиск драйверов автоматически», чтобы позволить Windows искать драйверы.
3. Перейдите на официальный веб-сайт поддержки HP.
Это немного менее удобный метод по сравнению с другими, однако он все еще работает как шарм. Вы можете просто позволить официальному веб-сайту HP просканировать ваш компьютер и порекомендовать драйвер для вашего устройства, а затем загрузить его. В противном случае вы также можете ввести номер модели вашего принтера и проверить доступные драйверы для вашего принтера.
Чтобы загрузить драйвер, используя номер модели принтера, щелкните параметр «Принтер».
Затем введите номер модели и выберите серию из предложенных.
После этого нажмите на опцию «Установка программного обеспечения», чтобы развернуть раздел. Затем нажмите «Загрузить» после опции «Полное программное решение HP». Затем используйте окно Проводника, чтобы сохранить файл на своем компьютере.
После загрузки перейдите к файлу и дважды щелкните .EXEфайл, чтобы запустить программу установки.
На экране появится окно UAC (Контроль учетных записей). Если вы не вошли в систему с учетной записью администратора, введите учетные данные для нее. В противном случае нажмите кнопку «Да», чтобы продолжить.
После этого нажмите кнопку «Продолжить», чтобы продолжить.
Нажмите кнопку «Далее».
Затем нажмите «Я просмотрел и принял соглашения об установке и настройки», а затем нажмите «Принять».
После этого, если вы хотите включить «Веб-печать», нажмите кнопку «Да», чтобы продолжить. Подождите несколько минут, пока программное обеспечение не установится на ваше устройство. После установки перезагрузите устройство, и вы сможете начать использовать принтер.
Если у вас есть устройство HP, вы также можете загрузить «Помощник по поддержке», который обнаружит и выведет для вас последнюю версию драйвера принтера.
Чтобы загрузить «Помощник по поддержке», на главном экране веб-сайта нажмите «Ноутбук/компьютер».
После этого введите серийный номер вашего устройства (обычно на нижней панели вашего устройства) и нажмите кнопку «Отправить». В противном случае щелкните параметр «Автоматически определять ваш продукт», чтобы загрузить программное обеспечение для определения сведений о вашем компьютере.
Если вы выбрали опцию «Автоматически определять ваш продукт», на вашем экране может появиться всплывающее окно. Согласитесь с условиями, поставив галочку. Затем нажмите на кнопку «Начать загрузку».
Затем перейдите в каталог загрузки и дважды щелкните файл.EXE, чтобы начать установку.
После установки программного обеспечения веб-сайт сможет определить номер модели вашего ПК и отобразить драйверы для него.
Затем найдите категорию «Принтер» и щелкните ее, чтобы развернуть. Затем нажмите «Загрузить» после самого последнего драйвера, чтобы начать загрузку.
Примечание. Если вы не видите раздел принтера, убедитесь, что вы подключены к принтеру.
Наконец, дважды щелкните.EXE файл, чтобы начать установку драйвера на свой компьютер.
После этого нажмите кнопку «Далее», чтобы продолжить.
Затем щелкните переключатель перед параметром «Я согласен с условиями лицензионного соглашения» и снова нажмите кнопку «Далее».
Еще раз нажмите кнопку «Далее» на следующем экране.
После установки перезагрузите компьютер, чтобы изменения вступили в силу.
Вот и все, вы успешно загрузили и установили драйвер принтера на свой ПК с Windows 11, используя веб-сайт производителя.
Если вы не хотите загружать программное обеспечение на свой ПК, вы также можете просто ввести номер модели вашего принтера, чтобы загрузить программное обеспечение.
4. Используйте HP Smart из Microsoft Store
Хотя приложение HP Smart не позволяет загружать драйвер явно, оно может сканировать подключенные принтеры и настраивать их для вас. Не только это, но также поможет вам в печати и сканировании документов (если ваш принтер оснащен сканером).
Сначала перейдите в меню «Пуск» и щелкните плитку «Магазин Microsoft». В противном случае вы также можете ввести Storeего для поиска.
После этого введите HP Smartв строку поиска и нажмите Enter, чтобы продолжить.
Затем нажмите кнопку «Установить», чтобы установить приложение.
Наконец, перейдите в меню «Пуск» и введите HP Smart, чтобы выполнить его поиск. Затем щелкните плитку «HP Smart», чтобы продолжить.
Затем нажмите кнопку «Принять все», чтобы продолжить.
После этого нажмите «Настроить новый принтер», чтобы продолжить.
На следующей странице будет выполнен поиск подключенных принтеров. Как только он появится в списке, нажмите на него, чтобы продолжить.
Затем HP Smart настроит его и подготовит к использованию. Затем вы можете использовать интеллектуальное приложение HP для печати или сканирования документов на устройстве с Windows 11.
Вот об этом. Отсутствие драйвера принтера может быть очень неприятным и неудобным. Однако, используя перечисленные выше методы, вы можете легко загрузить драйвер и начать печатать свои фотографии/документы.
2022 год почти закончился, и между последние новости декабря связано с выпуски новой версии приложений, полезных и доступных для использования в GNU/Linux, мы обнаружили наличие Версия 108.0.5500.0 из Веб-браузер SRWare Iron.
Кроме того, это хороший момент, чтобы сделать это, так как, назад более десяти лет что мы не касались здесь в DesdeLinux этот интересный веб-браузер, который включает в себя полезные функции и возможности, что делает его очень универсальным для многих пользователей на различных типах оборудования и в различных ситуациях. Как мы увидим позже.